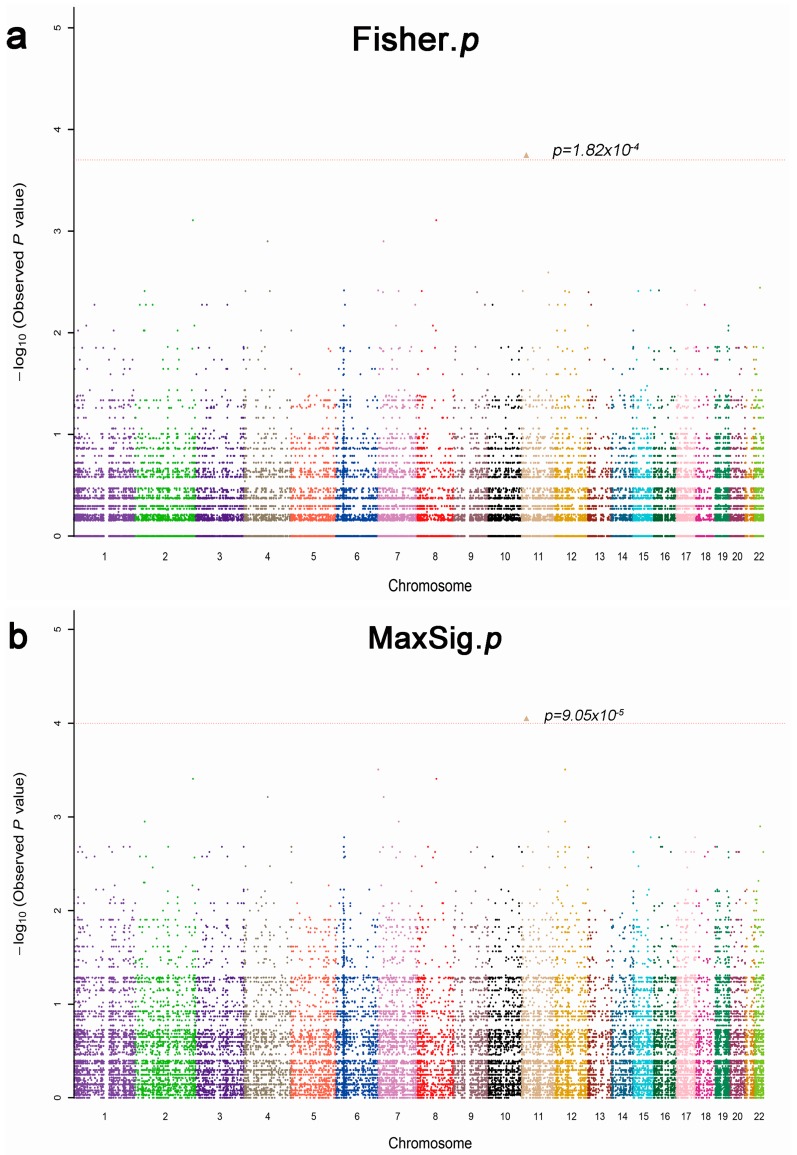
Figure 1.
Manhattan plot of allele association tests of all SNPs (single nucleotide polymorphisms), that passed extreme phenotypes in 13 patients (five response and eight nonresponse). The different colors mean different chromosomes. (a) Fisher’s exact test, the most significant SNPs rs2241984, Fisher. p = 1.82 × 10⁻⁴; and (b) MaxSig. p is the most significant result in three methods of association analysis: Cochran–Armitage trend test, Fisher’s exact test, and different genetic models (dominant, recessive and general) test. The most significant SNPs rs2241984 MaxSig. p = 9.05 × 10⁻⁵.

