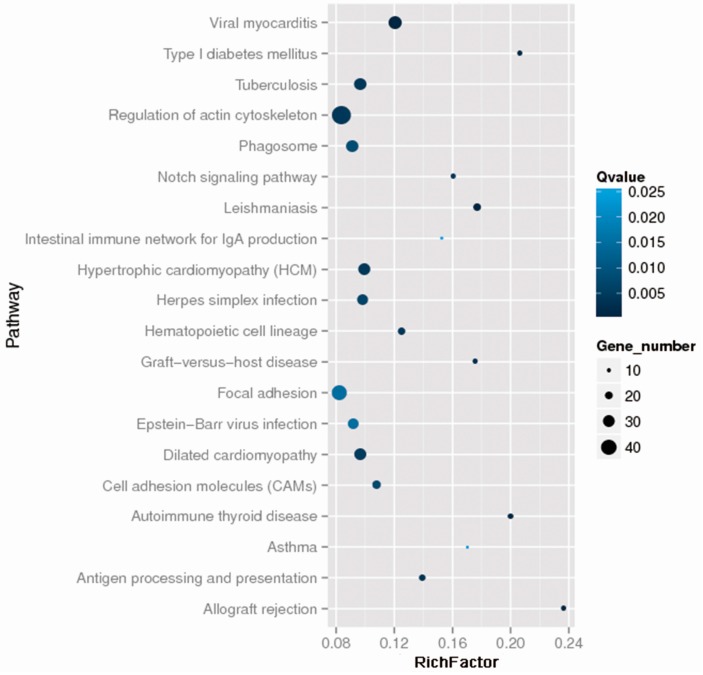
Figure 2.
The top 20 statistics of Pathway Enrichment. The darker the color is, the more significant the Qvalue is; the Viral myocarditis pathway is the most significant among the top 20 statistics of Pathway Enrichment. The larger the circle area is, the higher the number of genes; the number of genes in the Regulation of the actin cytoskeleton pathway is the largest among the top 20 statistics of Pathway Enrichment.

