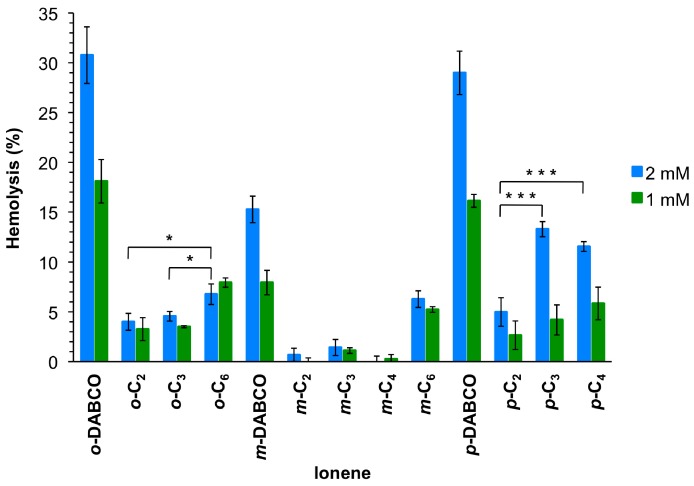
Figure 3.
Mean values of hemolysis from at least three replicates with SD and ANOVA with Bonferroni comparison. For the sake of clarity, only comparisons within one topomeric set (ortho-, meta-, para-) at 2 mmol/L are shown in this plot. All DABCO-containing compounds showed higher hemolysis (***, omitted for clarity) in comparison to their set members. * Indicates p < 0.05; *** indicates p < 0.001. See Supplementary Material for additional comparisons (Figures S19 and S20).

