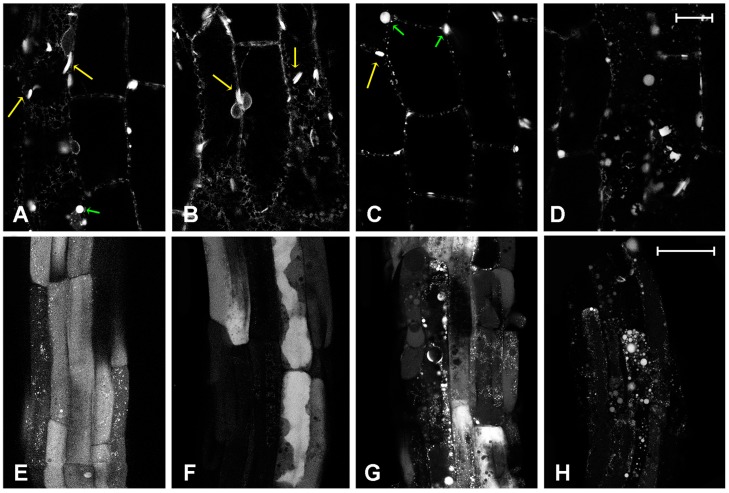
Figure 4.
Fluorescent patterns of AleuGFP vacuolar marker, in different tissues. (A) Single confocal section of hypocotyl’s cells in control; (B) Hypocotyl’s cells treated with 5 mg/L (13 µM) kiteplatin; (C) 5 mg/L (13 µM) oxaliplatin or (D) 5 mg/L (17 µM) cisplatin. Long yellow arrows indicate endoplasmic reticulum (ER) bodies while short green arrows indicate different large round-shaped compartments. Four confocal sections projection of young root at the end of elongation stage (emerging trichoblasts) in (E) control conditions or treated with (F) 10 mg/L (26 µM) kiteplatin; (G) 10 mg/L (25 µM) oxaliplatin; or (H) 10 mg/L (33 µM) cisplatin. Scale bar: 20 µm.

