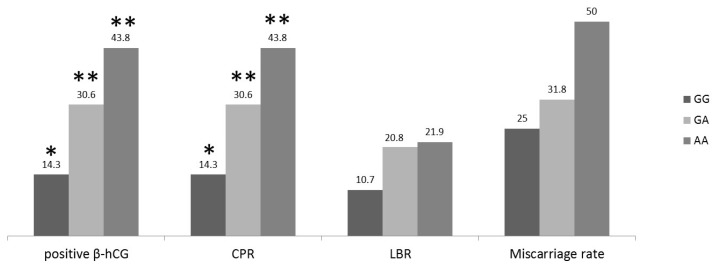
Figure 1.
Pregnancy rates per cycle of women (expressed in percentage) according to the genotype of their husbands; The rates of positive β-human chorionic gonadotropin (β-hCG) and clinical pregnancy (CP) of the genotype GG vs. the respective rates of the genotypes GA and AA were significantly lower (p < 0.05). Live birth rates (LBRs) were comparable between the three groups (** vs. *, p < 0.05).

