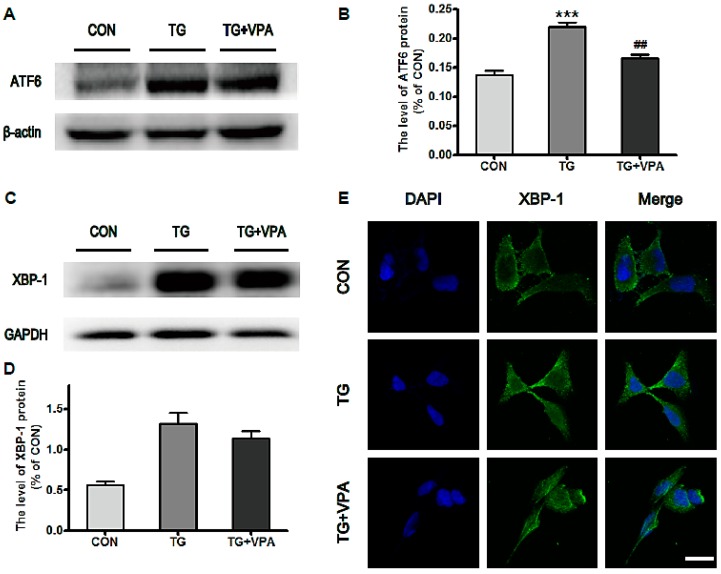
Figure 3.
VPA attenuates TG induced ER stress in SH-SY5Y cells. (A,C) The protein level of ATF6 and XBP-1 in the control, TG, and TG and VPA groups; (B,D) The optical density analysis of ATF6 and XBP-1 protein. ## p < 0.01 versus the TG group; *** p < 0.001 versus the control group; (E) Immunofluorescence of XBP-1 (green); the nuclear (blue) was labelled with DAPI. Magnification was 40×. Data are the mean values ± SEM, n = 3.

