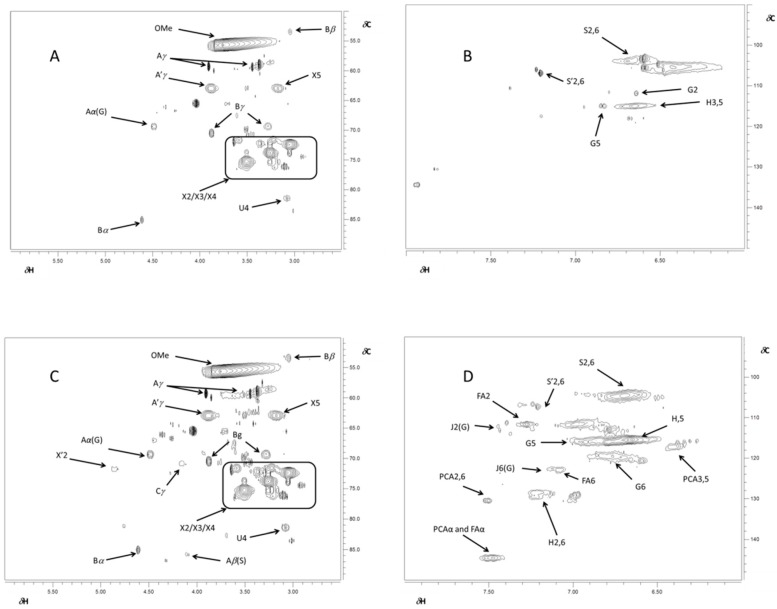
Figure 6.
13C-1H 2D-HSQC NMR spectra of alkyl-oxidized (δC/δH 50–90/2.5–6.0 ppm) and aromatic (δC/δH 90–106/6.0–8.0 ppm) regions of lignins isolated from Chamaecytisus proliferus (A,B) and wheat (C,D), respectively. Spectra for lignins isolated from Leucaena and barley are shown in Figure S2 (Supplementary Materials), due to their close similarities with the spectrum of Chamaecytisus lignin. Labels refer to identified lignin sub-units (shown in Figure 7), whose signal assignment is reported in Table 5.

