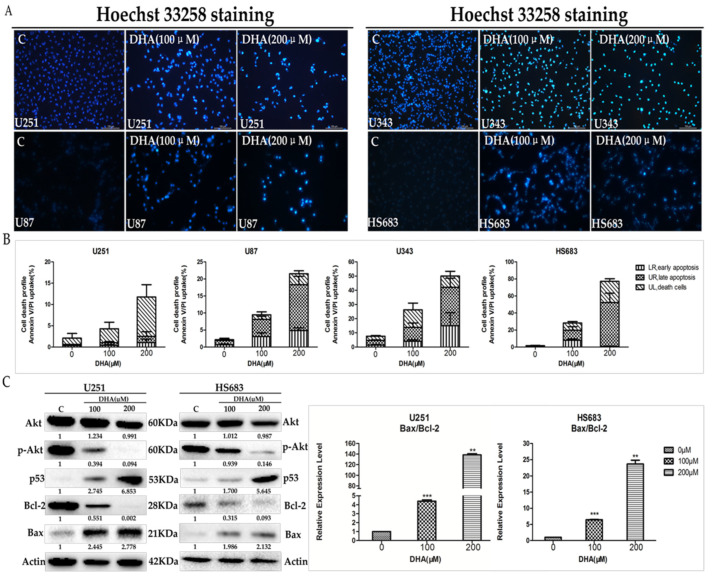
Figure 2.
Effect of DHA on malignant glioma cells apoptosis by regulating AKT axis. The indicated cells were treated with 100 and 200 μM DHA for 48 h. (A) Cells stained with Hoechst 33258 were detected and calculated by fluorescent photomicrographs at 10×; (B) cells were labeled with Annexin V/Propidium Iodide (AnnexinV/PI) and detected by flow cytometry. Values were mean ± SD (n = 3); (C) the proteins associated with AKT/p53/Bcl-2/Bax axis in malignant glioma cells were determined by western blot analysis. The changes of Bax/Bcl-2 ratio were evaluated by western blot analysis. Values were mean ± SD (n = 3). ** p < 0.001, *** p < 0.0001 as compared with negative control cells.

