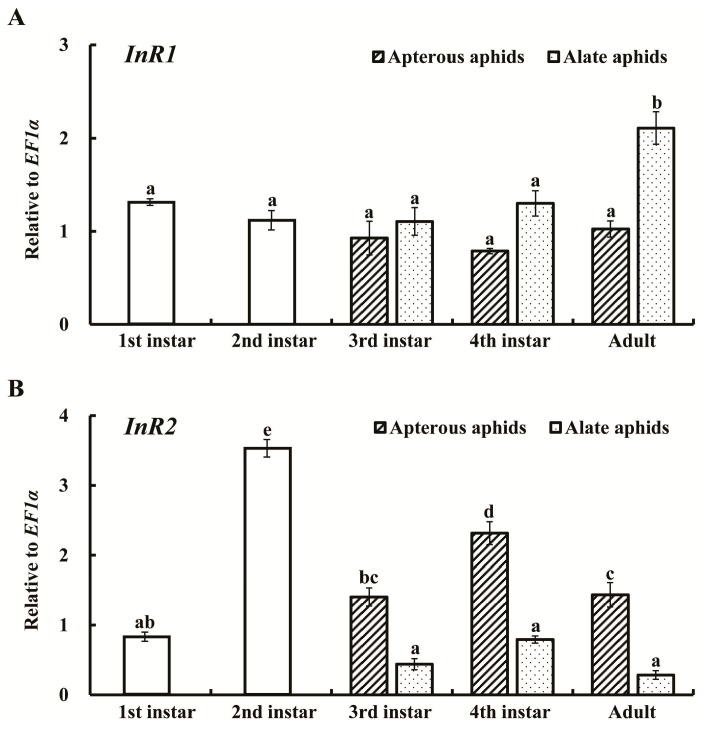
Figure 2.
Expression profiles of AcInR1 (A); and AcInR2 (B) at different developmental stages of Aphis (Toxoptera) citricidus. The mean (±SE) expression level is based on four biological replicates. Different lowercase letters (a, b, c, d, e) above each bar indicate significant differences among different developmental stages and wing morphs using one-way ANOVA followed by Tukey’s honestly significant difference (HSD) multiple comparison test (p < 0.05).

