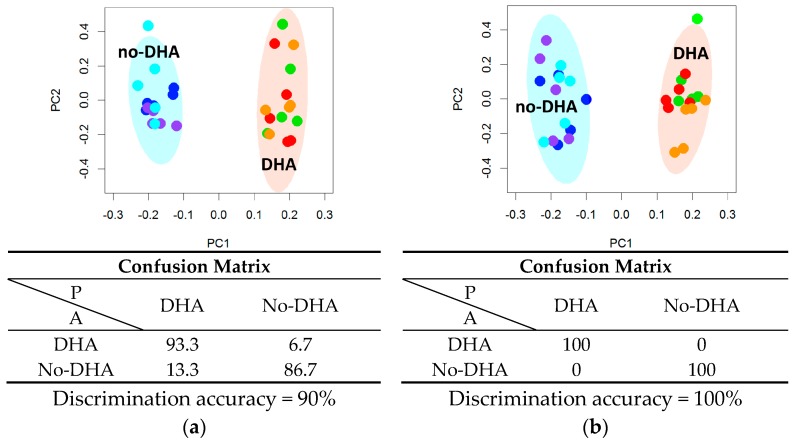
Figure 1.
Lipidomic phenotyping by nuclear magnetic resonance (NMR) analysis of cells not supplemented and supplemented with docosahexaenoic acid (DHA), alone or in combination with protocatechuic acid (PCA) or propionic acid (PRO), for (a) 6 h and (b) 24 h. Principal component analysis and canonical analysis (PCA-CA) score plots: PC1 vs. PC2. In each group, five samples derived from three independent experiments were analyzed. Each symbol represents a different sample. Blue symbols = NS; purple symbols = PCA; cyan symbols = PRO; orange symbols = DHA; green symbols = DHA + PCA; red symbols = DHA + PRO. For each PCA-CA model, the confusion matrix and the discrimination accuracy are reported; A: actual classes; P: predicted classes.

