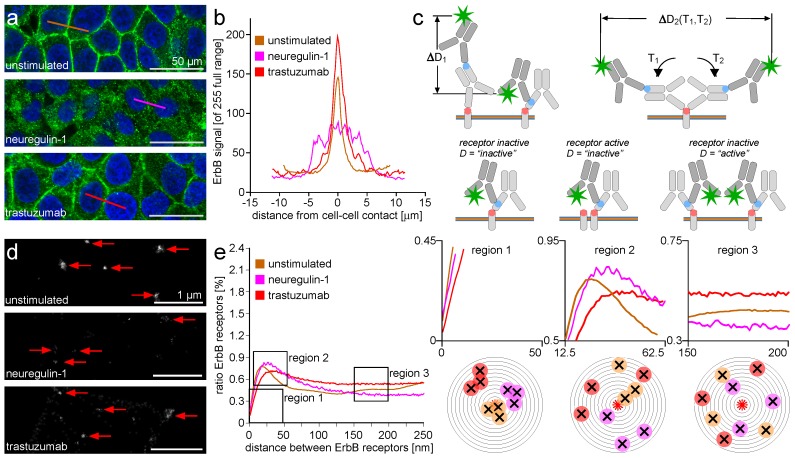
Figure 1.
ErbB-2 receptor nm range organization and m range movement upon activation by neuregulin-1 (NRG-1) and attenuation by the therapeutic antibody trastuzumab. Illustration of the short-range distance deterioration after ErbB-2 by secondary antibody identification and the resulting distance distribution spectra. (a) A nearly confluent monolayer of MCF-7 mamma-epithelial cells recorded by confocal laser scanning microscopy (CLSM). The cells are fixed and stained for ErbB-2 receptors by indirect immunofluorescence (green) and for the cell nucleus by the nucleic acid sensitive stain using 4,6-diamidino-2-phenylindole (DAPI) (blue). Comparison of an unstimulated monolayer (top) with a monolayer after NRG-1 stimulation (middle) and trastuzumab attenuation (bottom). The overall receptor distribution appears accumulated at the cell-to-cell contacts for the unstimulated and attenuated cells and mobilized into the cytosol NRG-1-mediated cell stimulation. The golden, purple, and red lines indicate a typical cell location for the generation of intensity line plots. (b) Intensity line plots for for the regions of interest (ROIs) selected in the cell monolayer for unstimulated (golden trace), NRG-1 stimulated (purple trace), and trastuzumab attenuated (red trace) cells. The abscissa origin (0) is normalized to the cell-to-cell contact. (c) A set of alternative typical spatial orientations of the primary to secondary antibody arrangement after indirect immuno-staining. The plasma membrane is represented in side view by the triple layered with the orange center and the blue border. The round corner box with the red dot represents the ErbB receptor and the epitope for the primary antibody (light grey). The primary antibody itself presents an epitope for the binding of the secondary antibody (dark grey). Variations in the spatial orientation of this group is responsible for the different distances between the ErbB receptor and the fluorescent dye (green asterisk). Alternations inside this set may account for a staining-dependent limit for localization precision. Some varieties of the spatial constellation designate an (activated) receptor accumulate as inactive and vice versa. (d) Localization matrix graphical display of the specimen described above but analyzed by localization microscopy (LM). The red arrows hint to local ErbB-2 receptor accumulations. All localities are in direct neighborhood to cell-to-cell contacts. (e) Receptor density spectra of the same localization matrix data set with abscissa ranging from 0–250 nm and the ordinate showing the relative ratio (in percent) of the total receptor number. The left diagram displays a complete survey, while three smaller diagrams on the right show typical distance distributions in the survey. The concentric ring series under each small coordinate system gives a graphical interpretation of the particular distance distribution inspired by Ripley’s K/L-based analysis. in each case the red asterisk indicates the common point of the distance measurements. The crosses around the center indicate the loci of protein molecules their distance is to be measured. A ring series acts as a scaffold for the distance classification of the distances between the asterisk in the center and each molecule around. The data set reflecting the center-to-molecule distances can be converted into a data set reflecting the distances between the protein molecules. See text for closer interpretation.

