Figure 2.
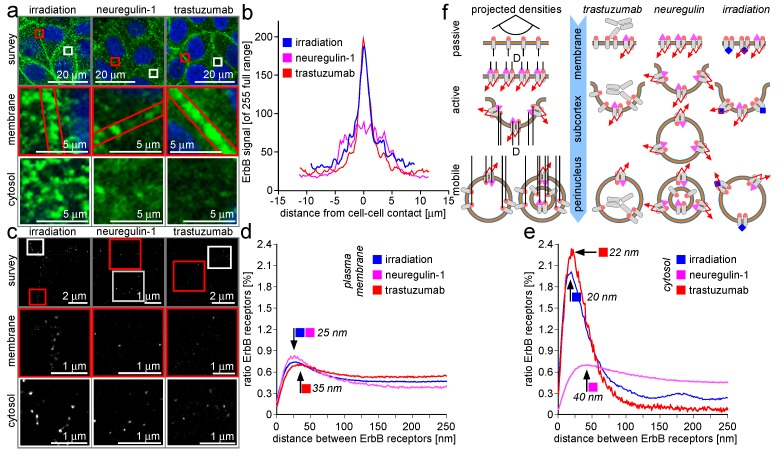
After the application of NRG-1, trastuzumab, or DNA-injuring irradiation, ErbB-2/3 receptors are mobilized from their initial residues in the plasma membrane and subject to retrograde trafficking. In this context, aside from a displacement in the m range, alterations in the packing density on the nm level take place. (a) A nearly confluent monolayer of MCF-7 breast epithelial cells recorded by CLSM. DNA stain and antibody stain as well as color-coding as in Figure 1. The top row shows a cell survey with close up as shown in the insets (red and white boxes). The middle row shows cell-to-cell contact regions, while the bottom row shows the cytosol distant from the contacts. The columns show representative cells after irradiation (left), NRG-1 stimulation (middle), and trastuzumab attenuation (right). The red boxes in the middle column indicate the cell-to-cell contact region. For closer interpretation, see text. (b) Intensity profiles as described in Figure 1, but with the unstimulated case replaced by the irradiation case. (c) LM localization matrix visualizations with the selection according to the CLSM-based collection in (a). Again, surveys and details (red and white boxes) of plasma membrane and cytosol regions of the three cases of cell manipulation are given. (d,e) Inter-receptor distance plots for NRG-1 (purple), trastuzumab (red), and irradiation (blue) application—(d) for receptor clusters at the cell-to-cell contact region and (e) for the situation inside the cytosol. The black arrows indicate the local maxima of the curves. The color boxes indicate the manipulation resulting in the graph. (f) A collection of schemes clarifying the modes of ErbB-2/3 receptor dimers packing and retrograde trafficking. The optical effects arising when a plane plasma membrane-residing receptor population is undergoing budding, vesicle formation, and subsequent vesicle recombination. The linear arrangement of the receptor dimers is a side view onto the plasma membrane (top row). The straight membrane becomes curved during the process of budding (lobed structures immediately below). Four types of receptor loaded vesicles are displayed as circles at the bottom of collection (f). To the right of the blue arrow, a combination of different trafficking modalities as suggested by the CLSM and LM data are given. The arrow indicates the main traffic direction from the plasma membrane into the cytosol in the three cases of cell manipulation. For closer explanations, see text.

