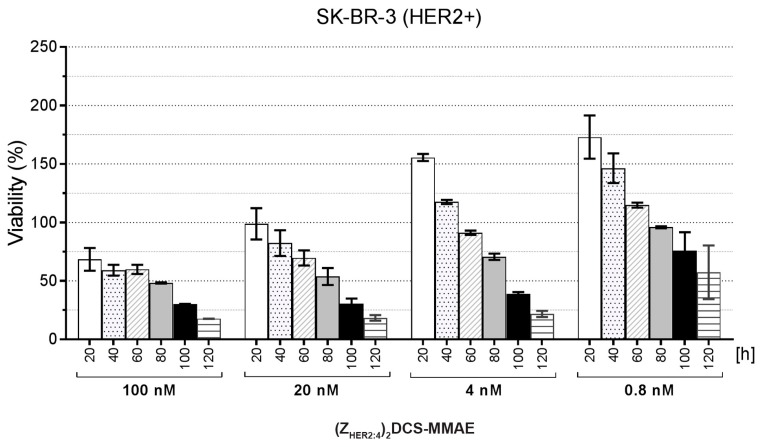
Figure 8.
The xCELLigence experiment performed on SK-BR-3 cells treated with (ZHER2:4)2DCS-MMAE. Results are shown for the selected time points of 20, 40, 60, 80, 100, and 120 h. Results were normalized against the control cells treated with PBS at each time point. The error bars show the standard deviation.

