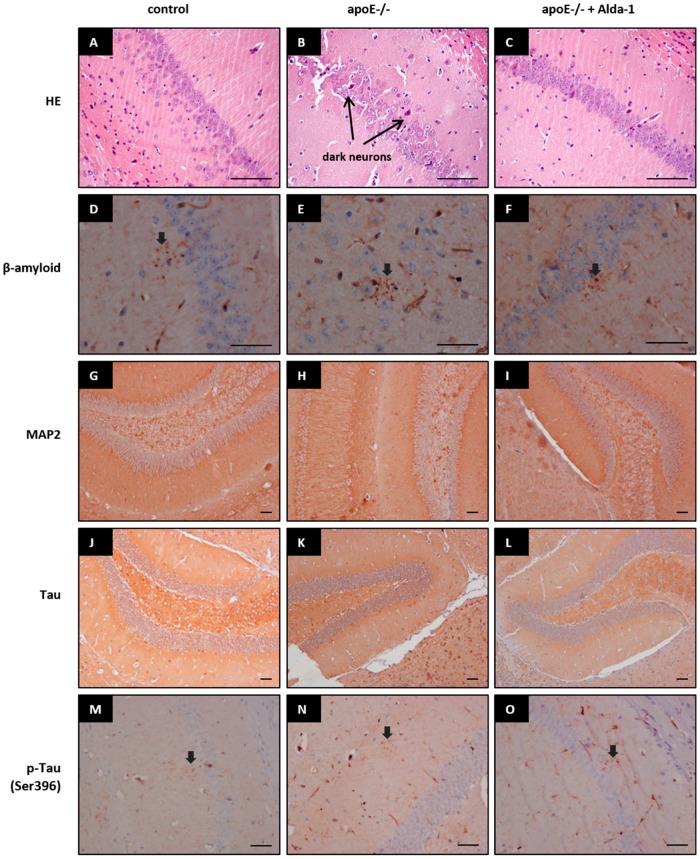
Figure 2.
Representative images of hematoxilin and eosin (HE) (A–C), β-amyloid (D–F), microtubule-associated protein 2 (MAP2) (G–I), Tau (J–L), and p-Tau (Ser396) (M–O) staining in brains of control mice, apoE−/− mice, and Alda-1-treated apoE−/− mice. Arrows indicate dark neurons, positive stainings of β-amyloid and p-Tau (Ser396), respectively. Scale bars = 500 µm.

