Figure 5.
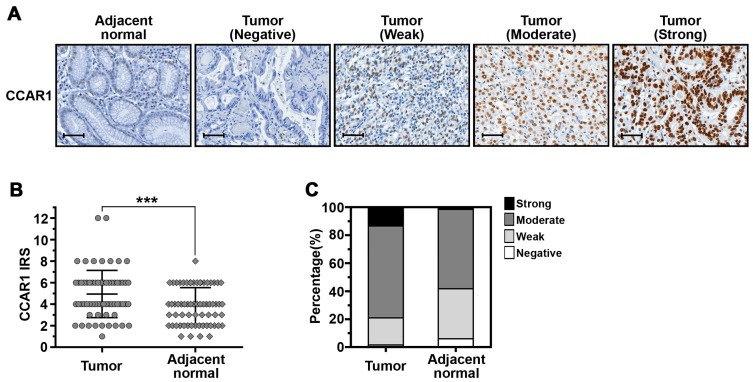
CCAR1 expression in human gastric cancer and matched adjacent normal tissues. (A) Representative images of immunohistochemical (IHC) staining for CCAR1 on the sections of gastric cancer tissues and their normal mucosa are shown. Scale bar: 40 μm (B) Scatter plot depicting CCAR1 levels as assessed by IRS (0–1 = negative staining; 2–3 = weak staining; 4–6 = moderate staining; 8–12 = strong staining) in tumors and adjacent normal tissues. Data are presented as the mean with error bars representing the S.D. The p-value was determined by an unpaired test. The symbol *** indicates p < 0.001; (C) Bar charts showing the percentage of cases that demonstrated staining with different levels of CCAR1 in tumors and adjacent normal tissues.

