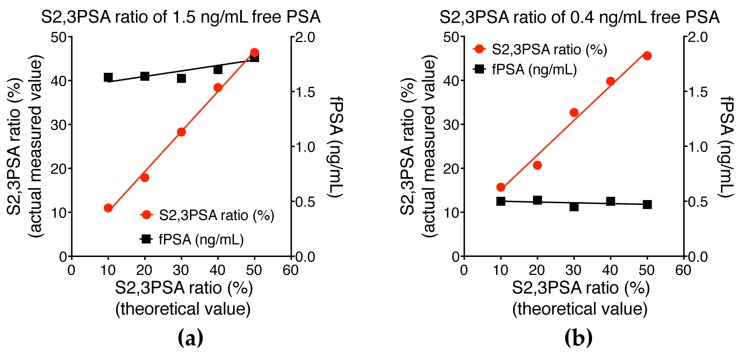
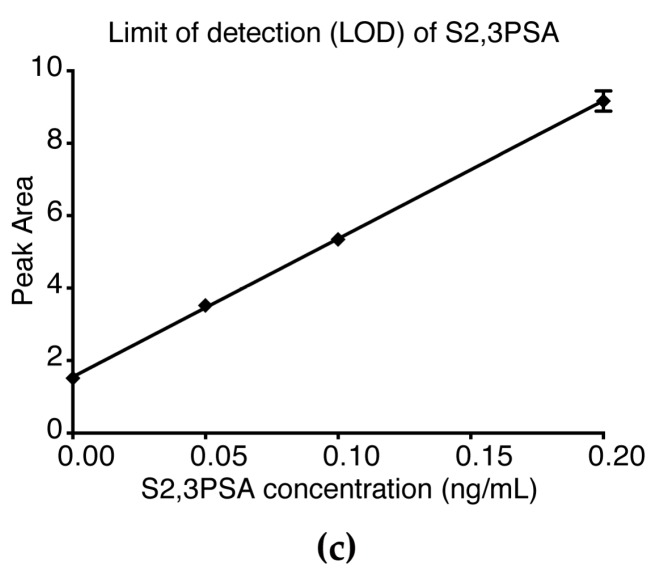
Figure 5.
Assay linearity for measurement of S2,3PSA ratio (%S2,3PSA) and limit of detection of S2,3PSA measurement. (a) Sample was a prepared sample, the original sample having an PSA concentration of 1.5 ng/mL and %S2,3PSA of 50.0%; (b) Sample was prepared by spiking with PSA (0.4 ng/mL) and %S2,3PSA at 50%. The two samples were serially diluted by control PSA containing S2,6 sialylation or asialo at the same concentration. PSA concentrations and %S2,3PSA were determined by the μTAS system; (c) The limit of detection (LOD) was 0.05 ng/mL, this level showing no overlap between the 2 standard deviation (SD) ranges for S2,3PSA concentration and negative control.


