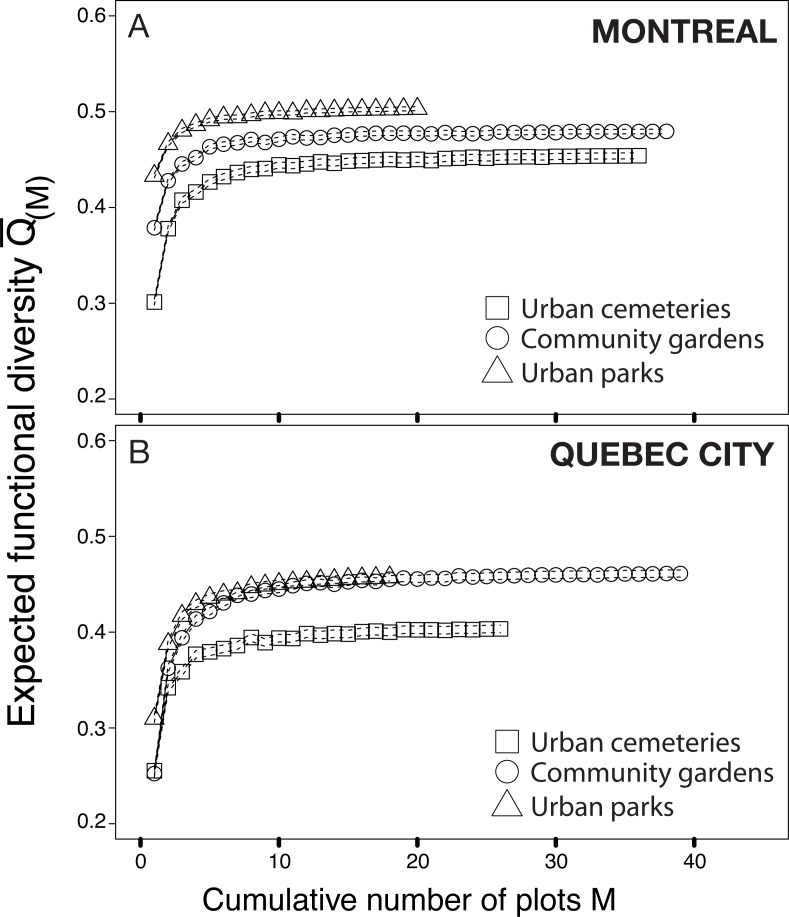
Figure 5. Functional rarefaction curves (mean expected functional diversity Q(M) as a function of the cumulative number of sampling plots M) for species abundance data from the three habitat types investigated in Montreal (A) and Quebec City (B).
The rarefaction curves are the result of 999 randomizations and the dotted lines of each curve are bootstrapped 95% confidence intervals.

