Fig. 1.
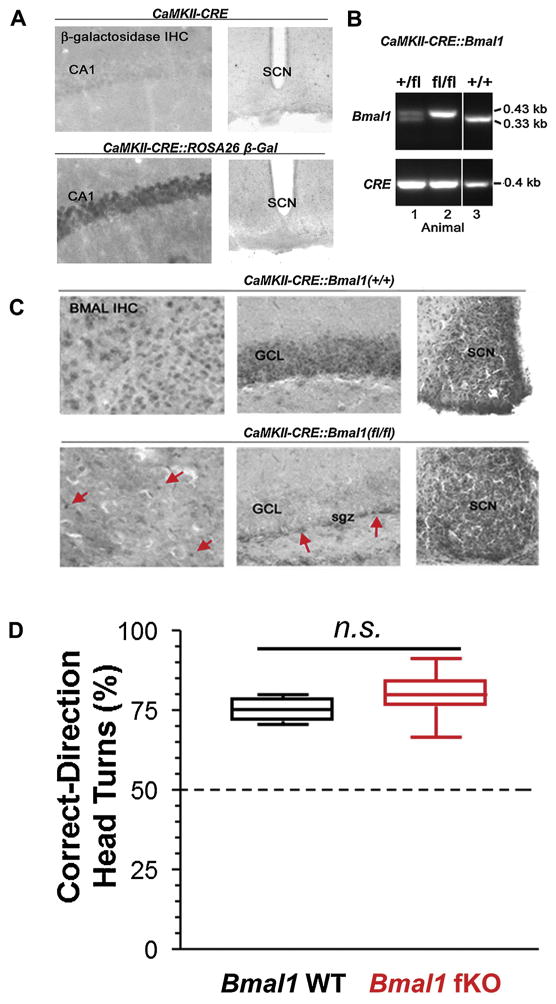
Generation of the Bmal1 forebrain knockout mouse line. For this study, we used a CaMKII driver line to target CRE recombinase to forebrain excitatory neurons. (A) To validate this targeting approach, we crossed the CaMKII-CRE line to the ROSA26 β-galactosidase reporter line, and CRE-mediated gal expression was examined via immunohistochemical (IHC) labeling. Of note, β-galactosidase transgene expression was detected in the CA1 neuronal cell layer, but not in the SCN, thus indicating that the driver expresses as expected: in excitatory forebrain neurons. (B) PCR validation of the successful generation of the CaMKII-CRE:Bmal1 floxed (fl/fl) mouse line. Note that mouse 2 has both two floxed copies of the Bmal1 allele and the CaMKII-CRE transgene. (C) Representative IHC labeling for BMAL1 in CaMKII-CRE control mice (CRE:Bmal1(+/+)) and CRE:Bmal1(fl/fl) mice. Forebrain BMAL1 labeling in the cortex (CTX) and granule cell layer of the hippocampus (GCL) was disrupted in the Bmal1 (fl/fl) mice. Of note, the CaMKII-CRE driver does not delete in all forebrain cells, only in excitatory neurons. In line with this, expression of Bmal1 in the CRE:Bmal1 (fl/fl) mice was still detected in non-neuronal cells and in interneurons. Arrows denote BMAL1 protein in what appears to be non-neuronal cells in the cortex and in the neurogenic niche within the subgranular zone (sgz) within the dentate gyrus. Importantly, Bmal1 expression in the SCN was not affected in the Bmal1 (fl/fl) mice. Together, these data indicate targeted deletion of Bmal1 was achieved. (D) To test for visual acuity, mice were tested for correct head turns using an optokinetic drum. Similar acuity was measured between the genotypes, and responses were significantly different from chance head turning level (50%) which is denoted by a black horizontal line. Data are presented as boxplots of the range (box indicates 2nd and 3rd quartiles, error bars indicate highest and lowest data points); n = 7–11 mice per group; n.s. p > 0.05.

