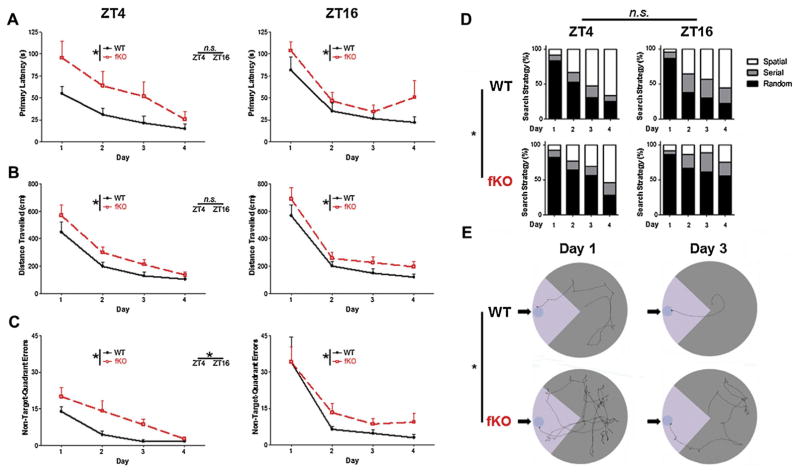
Fig. 4.
Barnes Maze acquisition. (A) Mean primary latency (i.e., seconds to reach the escape box) for the four days of acquisition are presented for mice trained at ZT4 or ZT16. Of note, Bmal1 fKO mice took significantly longer to find the escape box compared to Bmal1 WT mice at both zeitgeber times. (B) Distance travelled to reach the escape hole during the four days of acquisition for mice trained at ZT4 or ZT16. Bmal1 fKO mice travelled significantly longer distances compared to Bmal1 WT mice at both zeitgeber times (C) Non-target-quadrant errors during the four days of acquisition, for mice trained at ZT4 or ZT16. Bmal1 fKO mice made significantly more errors than Bmal1 WT mice at both zeitgeber times; mice trained at ZT16 made significantly more errors than mice trained during ZT4 for both genotypes. (D) Proportional representation of search strategies used by mice over the four days of acquisition; Spatial strategy indicates zero non-target-quadrant errors; Random indicates at least one non-target error and at least one center crossing; Serial indicates at least one non-target error but zero center crossings. Bmal1 WT mice used spatial strategies significantly more frequently than Bmal1 fKO mice. (E) Representative tracks of ZT4 mice prior to finding the escape box during days 1 and 3 of acquisition. Arrows indicate the escape box locations; lighter gray is used to denote the locations of the target quadrants. Data are presented as the mean ± SEM; analyzed by repeated measures two-way ANOVA; n = 12 to 15 mice per group; *p < 0.05.

