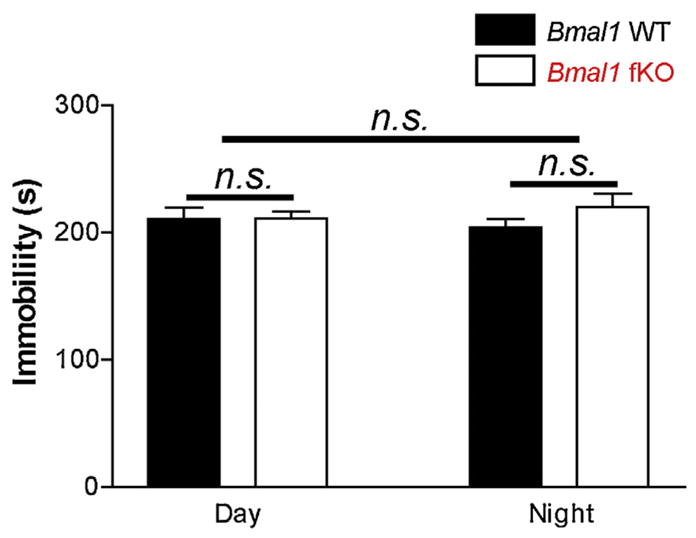
Fig. 8.

Tail suspension test. These data reveal a similar level of behavioral despair in both genotypes and at both times of day. Data are presented as the mean time-spent immobile (seconds: s) during the tail suspension test. Data are presented as the mean ± SEM; analyzed by two-way ANOVA; n = 13 to 16 mice per group; n.s. p > 0.05.
