Fig. 6.
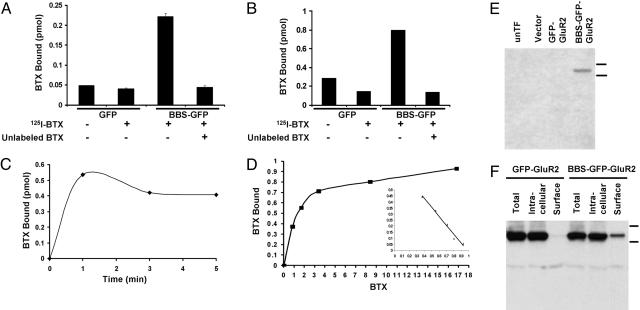
BTX binding assay using 125I-BTX in HEK 293 cell. (A) To measure surface expression, the cells expressing BBS-GFP-GluR2 or GFP-GluR2 were incubated with 125I-BTX in the absence or presence of unlabeled BTX at 17°C for 30 min, the cells were washed, and the 125I-BTX bound in the cell surface was measured. Robust 125I-BTX binding was detected in BBS-GFP-GluR2-transfected cells. (B) To measure total expression, detergent extracts of membrane fractions were incubated with 125I-BTX with or without unlabeled BTX for 30 min at room temperature, spotted onto DEAE filters, washed, and counted. (C) The time course of 125I-BTX binding was measured by using detergent extracts of membrane fractions for the indicated times. 125I-BTX binding was completed within 1 min. (D) The detergent extracts of membrane fractions were incubated with various concentrations of 125I-BTX, and the dissociation constant (Kd affinity) was quantified (Kd = 1.36 × 10⁻⁸ M) from the resulting Scatchard plot (Inset). (E) The BBS-GFP-GluR2 was specifically detected on Western blot by using biotinylated BTX and streptavidin-HRP. Lanes show untransfected cells (unTF), vector, GFP-GluR2, and BBS-GFP-GluR2 from left to right. (F) Surface BBS-GFP-GluR2, but not GFP-GluR2, was isolated from the transfected cells by using biotinylated BTX and NeutrAvidin beads.

