
Figure 1.
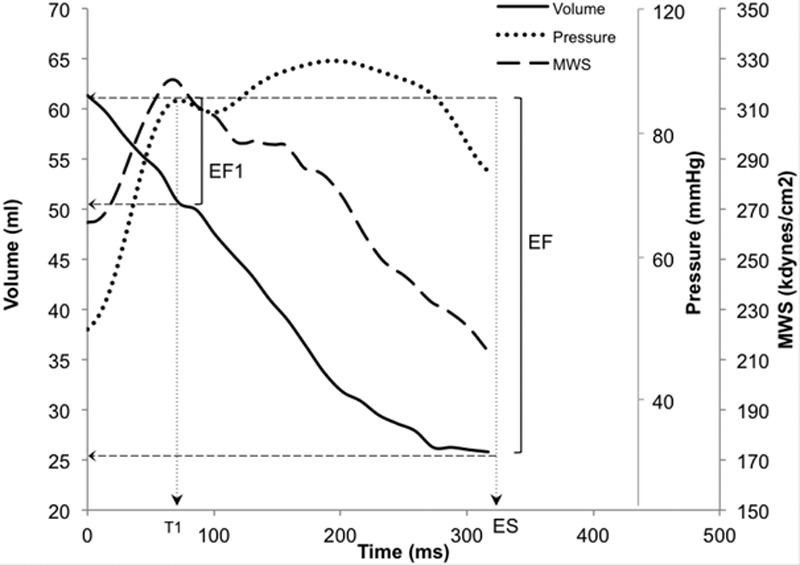
Endocardial volume curve (solid line) obtained by echo wall tracking, central aortic pressure waveform (dotted line) obtained by carotid tonometry, together with ejection-phase myocardial wall stress (dashed line), computed from the central aortic systolic pressure waveform and instantaneous left ventricular dimensions in a normotensive subject. Myocardial wall stress starts to fall at the first peak of central aortic pressure (T1), coinciding with peak aortic flow and maximal rate of ventricular shortening. First-phase ejection fraction (EF1) is percentage volume change between end diastole and T1. EF indicates ejection fraction; and MWS, myocardial wall stress.