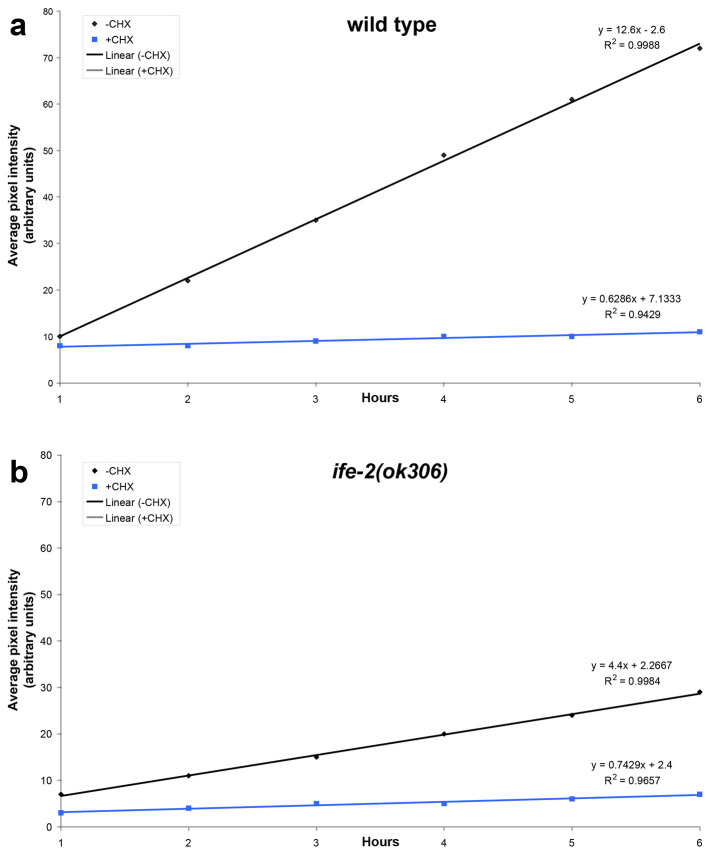
Figure 2. Regression analysis of fluorescence recovery in both wild type and IFE-2 deficient animals expressing pife-2GFP throughout somatic tissues.
Best-fit lines are generated for average pixel intensity values obtained during the recovery phase for the indicated genetic backgrounds (a, wild type; b, ife-2[ok306]; black lines). The respective equations describing best-fit lines as well as R2 values for each line are also shown. Line slope corresponds to the first derivative of fluorescent change within a time unit (Δf/dt), which is a measure of the recovery rate. Cycloheximide treatment (CHX; 500 μg/ml) results in negligible recovery rate (blue lines).

