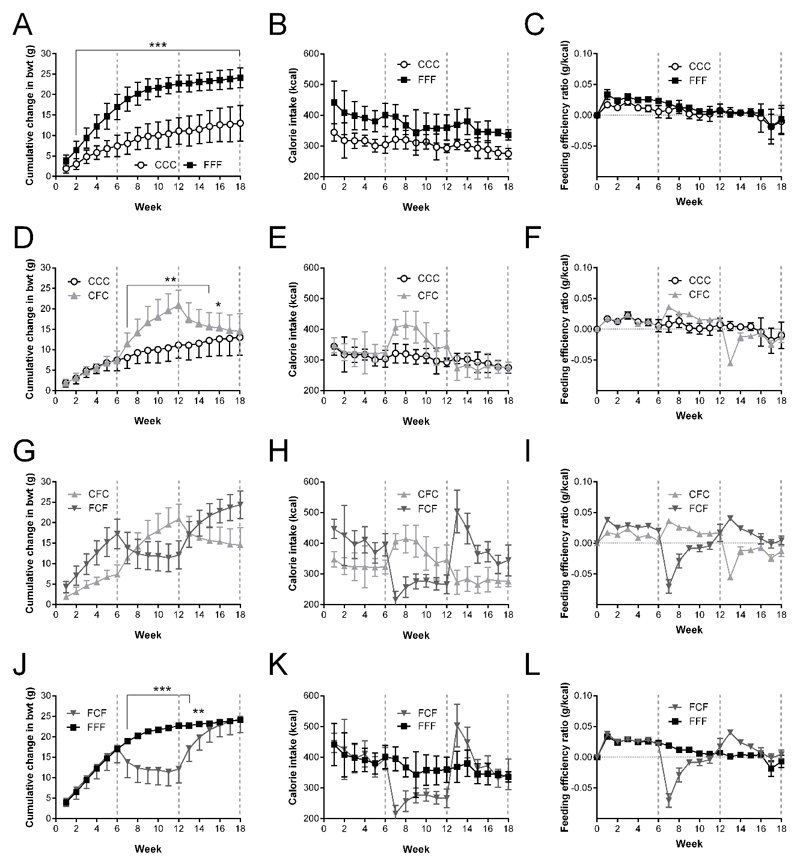
Figure 2. Changes in body weight, caloric intake and feeding efficiency in weight cycled animals.
Parameters recorded in mice placed on combinations of high fat (F) or normal fat (C) diet for recorded at 6 (C, F), 12 (CC, CF, FC, FF) and 18 weeks (CCC, CFC, FCF, FFF). CCC vs. FFF: (A) Cumulative change in body weight (Cuml. Bwt (g)), (B) Caloric intake (CI (kcal)), (C) Feeding efficiency (FE (g/kcal)); CCC vs. CFC: (D) Cuml. Bwt, (E) CI, (F) FE; CFC vs FCF: (G) Cuml. Bwt, (H) CI, (I) FE; FCF vs FFF: (J) Cuml. Bwt, (K) CI, (L) FE. Data presented as mean ± sem; n=28/group; statistical analysis performed using Two-Way ANOVA with Bonferroni Correction;* = p<0.05; ** = p<0.01; *** = p<0.001; dotted lines indicate at dietary switch points at 6 and 12 weeks. ○: CCC; ▴: CFC ; ▾: FCF; ■: FFF

