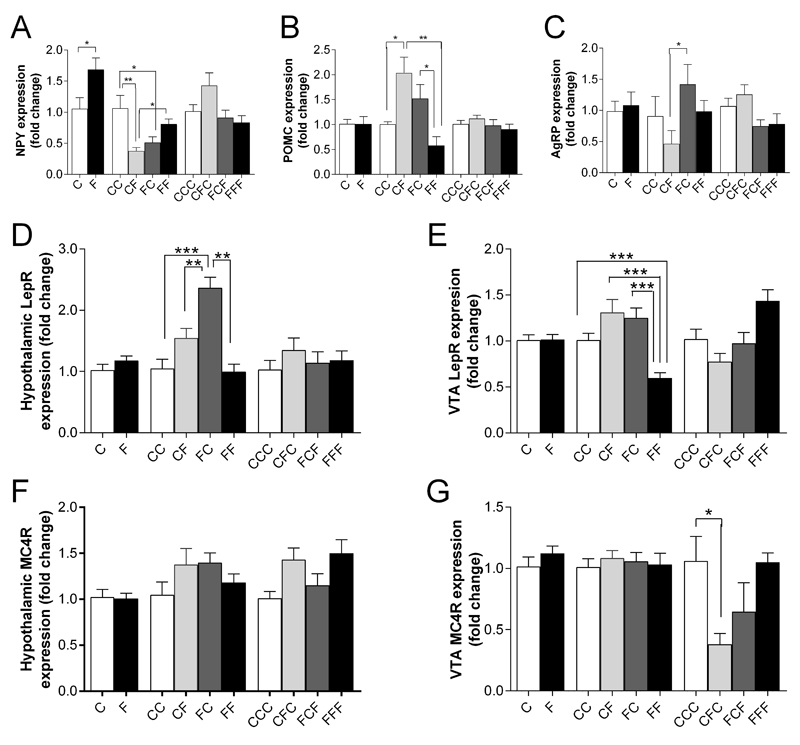
Figure 4. The effects of weight cycling on hypothalamic neuropeptide expression and receptor expression in the hypothalamus and ventral tegmental region (VTA).
RT-qPCR was used to assess hypothalamic neuropeptide and neuropeptide receptor expression in fold change (arbitrary units) at 6 (C, F), 12 (CC, CF, FC, FF) and 18 weeks (CCC, CFC, FCF, FFF). (A) NPY; (B) AgRP; (C) POMC; (D) LepR: Hypothalamus; (E) LepR: VTA; (F) MC4R: Hypothalamus; (G) MC4R: VTA. Data presented as mean ± sem; n=5-8/group; statistical analysis performed using an ANOVA with Bonferroni post-hoc test; * = p<0.05, ** = p<0.01, *** = p<0.001

