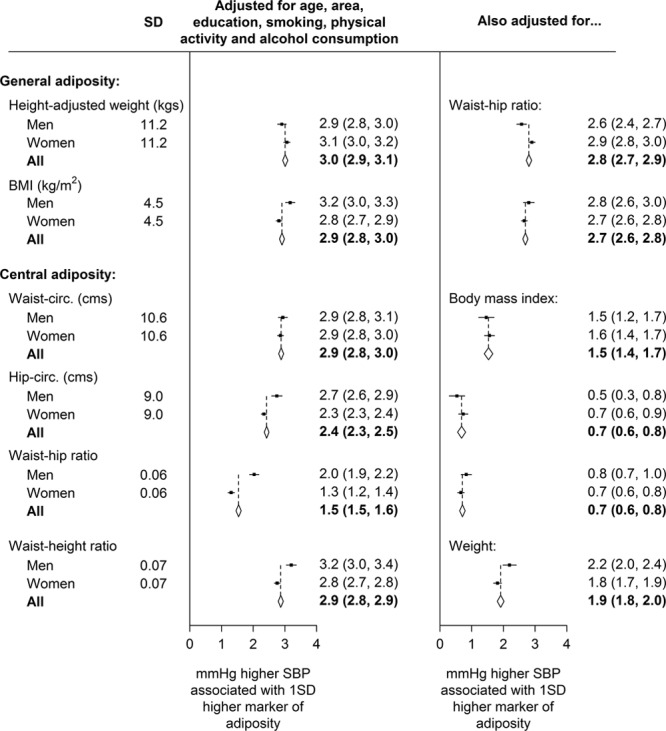
Figure 2.

. Overall and sex-specific relevance of each adiposity marker to systolic blood pressure (SBP), before and after additional adjustment for other adiposity markers. Each diamond represents the inverse variance–weighted average of the 2 estimates above it. For each marker of adiposity, the SD shown is the average of the SD in men and the SD in women (see Table 1 for the age- and sex-specific values). Values in parentheses are 95% confidence intervals. BMI indicates body mass index.
