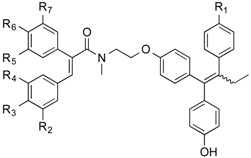
Table 3.
Antiproliferative effects of selected conjugate compounds in MDA-MB-231 human breast cancer cells a.
 | |||||||||
|---|---|---|---|---|---|---|---|---|---|
| Compound | R1 | R2 | R3 | R4 | R5 | R6 | R7 | IC50 (μM) b | % Cell Death at 10 μM c |
| 27 | H | OH | OMe | H | OMe | OMe | OMe | 2.67 | 17 |
| 28 | OH | OH | OMe | H | OMe | OMe | OMe | 2.48 | 15 |
| 29 | H | H | OMe | H | OMe | OMe | OMe | 30.6 | 2 |
| 30 | OH | H | OMe | H | OMe | OMe | OMe | 6.29 | 7 |
| 31 | H | OMe | OMe | OMe | H | OMe | H | 51.0 | 0 |
| 32 | OH | OMe | OMe | OMe | H | OMe | H | 4.09 | 0 |
| 33 | H | OCH2O | H | H | OMe | H | 5.23 | 0 | |
| 34 | OH | OCH2O | H | H | OMe | H | 0.68 | 16 | |
| 35 | H | -C4H4- | H | OMe | OMe | OMe | 2.16 | 0 | |
| 36 | OH | -C4H4- | H | OMe | OMe | OMe | 4.32 | 0 | |
| 41 | H | H | Br | H | OMe | OMe | OMe | >50 | 0 |
| 42 | OH | H | Br | H | OMe | OMe | OMe | >50 | 9 |
| 43 | H | F | OMe | H | OMe | OMe | OMe | 30.3 | 0 |
| 44 | OH | F | OMe | H | OMe | OMe | OMe | 1.85 | 14 |
| 45 | H | NH2 | OMe | H | OMe | OMe | OMe | 7.11 | 0 |
| 46 | OH | NH2 | OMe | H | OMe | OMe | OMe | 49.7 | 0 |
| Tamoxifen | 20 | 0 | |||||||
| Hydroxytamoxifen | 18 | 0 | |||||||
| 26 (CA4) | 0.043 | 4 | |||||||
a Mean IC50 values of compounds for their antiproliferative effects and percent cytotoxicity on a human MDA breast cancer cell line. b IC50 values are half maximal inhibitory concentrations required to block the growth stimulation of MDA-MB-231 cells. Values are an average of at least three experiments performed in triplicate with typical standard errors below 15%. c Lactate Dehydrogenase assay: Following treatment of the cells, the amount of LDH was determined using LDH assay kit from Promega. Data is presented as % cell lysis at compound concentration of 10 μM [66].
