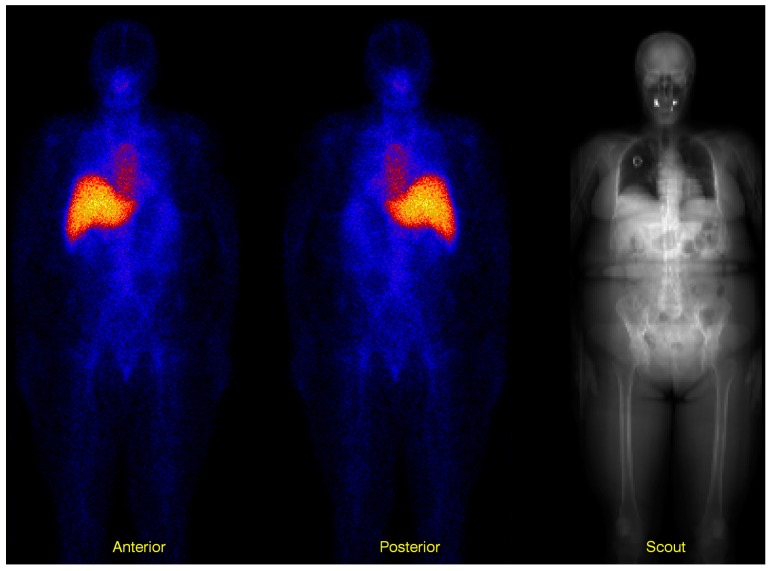
Figure 5.
Three images showing anterior and posterior whole-body images. Before applying the geometric-mean on a pixel-by-pixel level, the posterior image is mirrored. The image to the right is the scout image whose intensity describes the amount of photon attenuation in the patient. Bright areas indicate a large probability for photon attenuation. This image is acquired with the X-ray unit, and the values are scaled to represent the attenuation factor for the relevant photon energy. The spatial misregistration between the scout image and the two planar images is accounted for by an image registration procedure, tailored for whole-body images, as described further down in the text.

