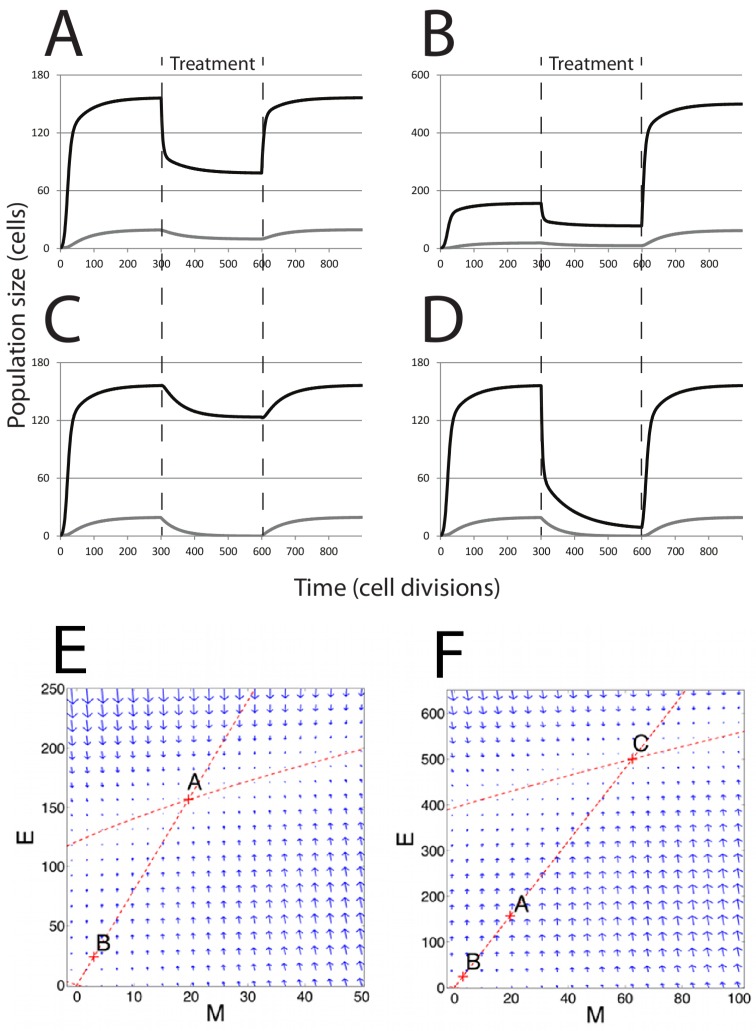
Figure 3.
Population dynamics in response to chemotherapy. Modeling chemotherapeutic treatment and recurrence; tumor population dynamics before, during and after a treatment regime (denoted by the dashed vertical lines). (A) Treatment consisting of an agent that increased cell death () in the E cell population. At the end of treatment, returns to its pre-treatment level; (B) The E cell population acquires resistance mutations following treatment ( is lower than before treatment); (C) Treatment consisting of an agent that prevents EMT; (D) Treatment consisting of both reduction and EMT prevention in combined therapy. In (C) and (D), recovery was to original pre-treatment parameter values; (E) The phase plane plot shows the behavior of the system around the fixed Point A (pre-treatment parameter values) and nullclines. Point B marks the system state after treatment; (F) Phase plane plot around the fixed Point C; parameter values after E cells have acquired mutations. In both (E) and (F), the fixed points shown are the only stable fixed points for the system in this state.

