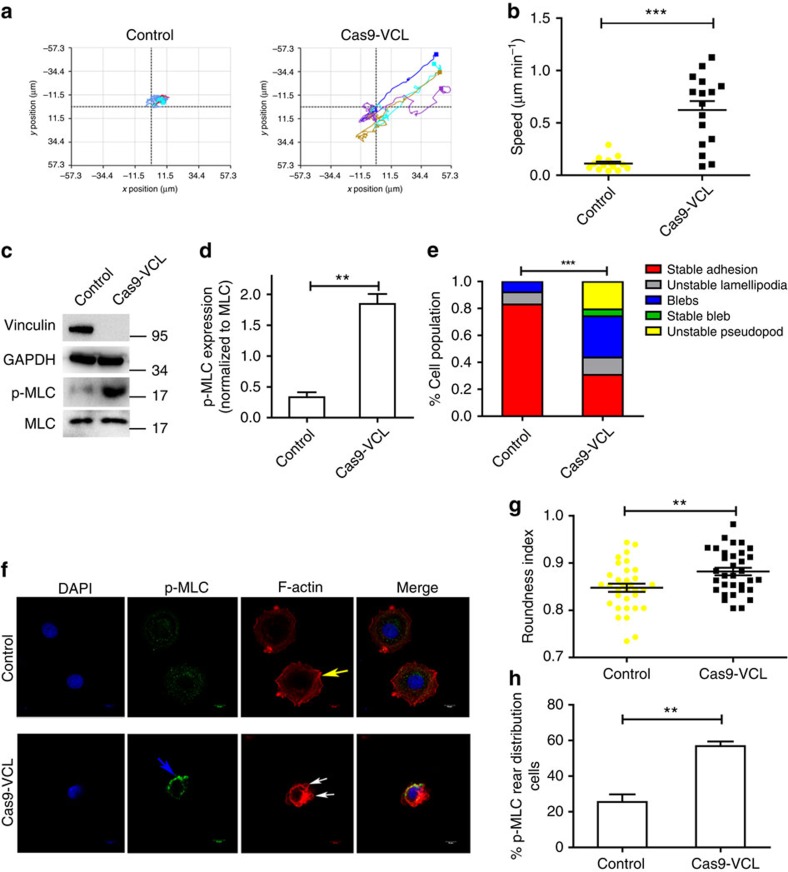
Figure 7. Loss of vinculin promotes amoeboid features of cancer cells.
(a) Representative tracks of control and Cas9-vinculin MCF-7 cells. (b) The migration speed of control and Cas9-vinculin MCF-7 cells in the 3D matrix (n=14, 16 cells). (c) Western blotting to detect the expression levels of MLC and p-MLC. (d) Quantification of p-MLC expression in c normalized to total MLC (n=3). (e) The percentage of cells exhibiting different phenotypes in the 3D matrix for control and Cas9-vinculin MCF-7 cells (n=43 and 39 cells, respectively). (f) Representative confocal images of p-MLC and F-actin immunostaining of control and Cas9-vinculin MCF-7 cells that were embedded in Matrigel. Scale bars, 10 μm. The blue arrow indicates the accumulation of p-MLC at the cell rear; the white arrows indicate dynamic blebs; and the yellow arrow indicates stress fibre. (g) Cell morphology (roundness index) of control MCF-7 cells and Cas9-vinculin MCF-7 cells (n=33 cells). (h) The percentage of cells from f exhibiting p-MLC rear distribution for control and Cas9-vinculin MCF-7 cells (n=3). (b,d,g,h) The data are shown as the mean±s.e.m. **P<0.01, ***P<0.001. (b,d,g) Unpaired t-test; (e) χ2-test; (h) Wilcoxon rank-sum test.

