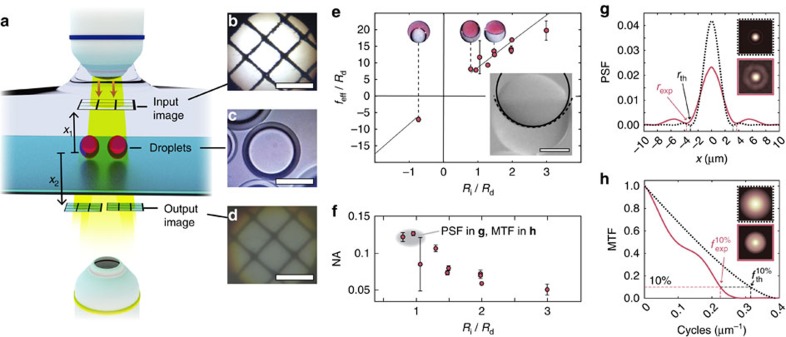
Figure 3. Characterization of the fluidic lenses' optical properties.
(a) Schematic of the optical setup used for focal length and image forming analysis. A grid image is projected in front of the droplets to serve as the object for the micro-lenses. The image formed by the droplets is recorded using a × 10 objective. (b) Image of a grid projected above the droplets. (c) A droplet viewed from above. (d) Image of the grid shown in b projected by the droplet displayed in c. Scale bars=100 μm (b–d). (e) Effective focal length as a function of internal radius of curvature Ri, normalized by the droplet diameter Rd. Error bars represent uncertainty in fit parameter f and uncertainty in measurement of internal curvature. The solid black line shows the expected focal length of the system given by the ray transfer matrix method. The bottom right inset shows a side view of a droplet with the same surfactant concentration as the droplet shown in c. The fit to the interface is shown with a solid line and the actual curvature is shown with a dashed line. Scale bar=100 μm. (f) Numerical aperture NA as a function of internal radius of curvature Ri, given by  . Here, the refractive index is n=1 (the image is formed in air). Error bars represent measurement uncertainty propagated from the uncertainty shown by the error bars in e. The grey-shaded area signifies the configuration of droplets for which the point spread function and the modulation transfer function are shown in g,h. (g) Point spread function estimate (PSF) of droplets with a numerical aperture NA=0.12 for red light (pink line). The theoretical PSF for a diffraction-limited lens with identical NA is shown as a dashed black line. The area under the curves is normalized to unity. Insets show the theoretical 2D PSF (black dashed frame) and the experimentally determined PSF (pink frame). The experimentally determined two-point resolution limit amounts to rexp=3.7 μm. (h) Modulation transfer function (MTF) for the same droplets. The cut-off frequency above which the image contrast is less than 10% amounts to
  =0.22 cycles per μm. Insets show the theoretical 2D MTF (black dashed frame) and the MTF determined from the experimentally obtained PSF (pink frame).

