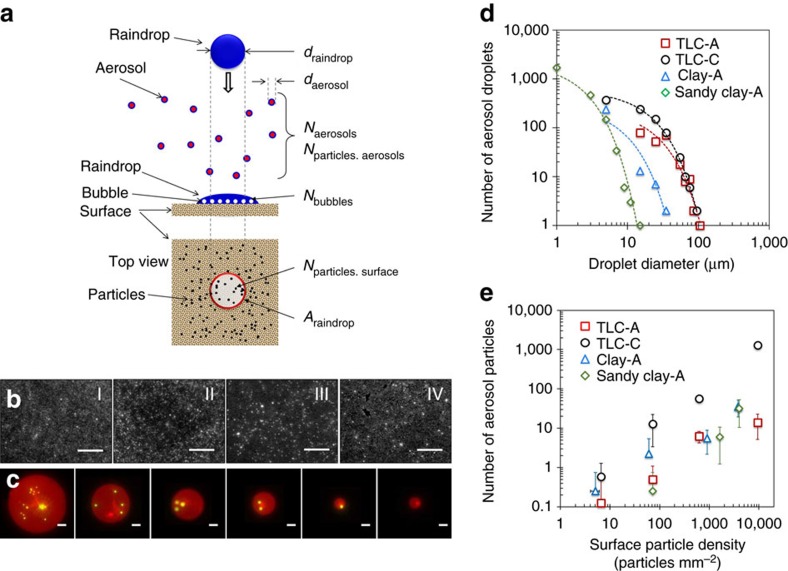
Figure 5. Particle transfer under different particle densities on soils.
(a) Schematic illustration of the key parameters related to particle dispersion by raindrop impact. (b) Fluorescence microscopy images of surfaces with different particle densities. The bright dots are 1 μm diameter yellow-green fluorescent microspheres. The approximate surface particle density of images I, II, III and IV are 10, 102, 103 and 104 particles per mm2, respectively. The scale bars represent 500 μm. (c) Aerosols containing 1 μm microspheres and collected on a sampling plate. The scale bars represent 25 μm. (d) The number of aerosols decreases exponentially with respect to aerosol diameter. (e) The total number of microspheres dispersed by a single raindrop is linearly proportional to the surface density of the microspheres. The surface temperature is 25 °C and the raindrop velocity at impact is 1.4 m s−1 for d and e. The error bars indicate±1 s.d. resulting from nine drop impingements. The dotted lines in d indicate exponential fitting lines.

