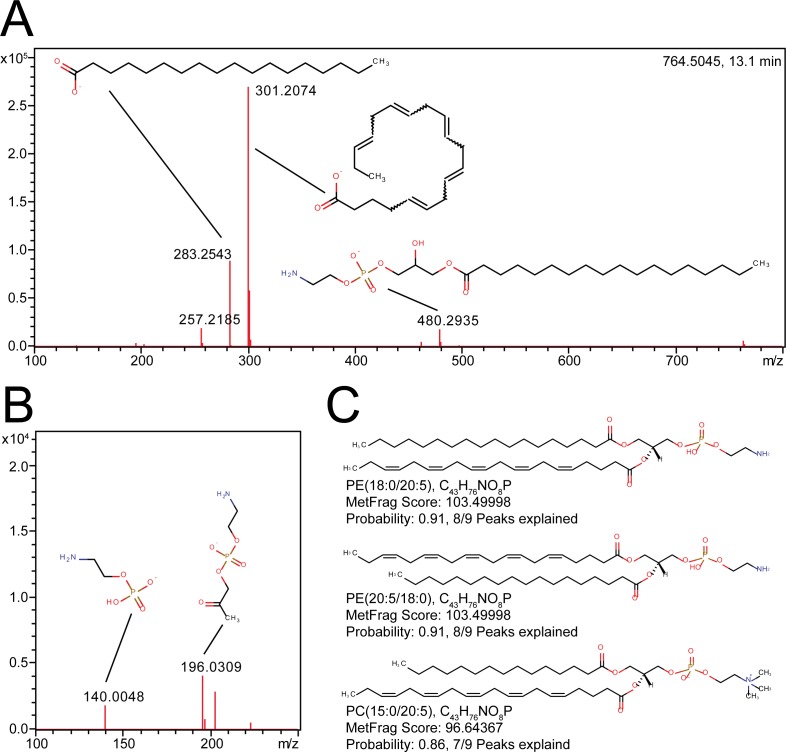
Fig 5. Example of a LipidFrag identification in C. elegans data.
(A) MS/MS spectrum of m/z 764.5045 at 13.1 minutes detected in C. elegans with fragment structures annotated. (B) Close up of lower mass region (m/z 100–250). (C) Structures of the best three candidates obtained from MetFrag with result filtering using foreground class probabilities. Name, formula, MetFrag score and probability are indicated below each structure.

