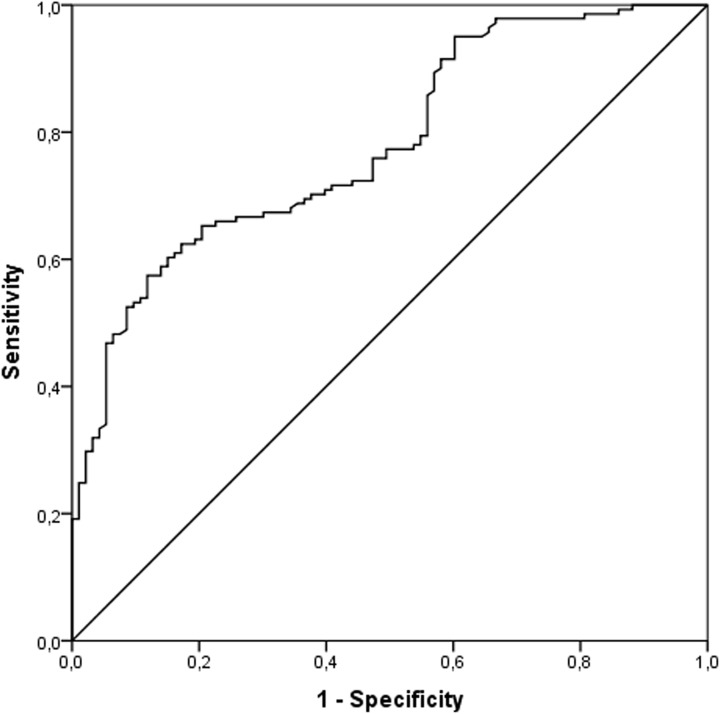
Fig 4. Receiver operating characteristics curve of sensitivity of heart failure prediction against specificity.
A risk score was calculated on the basis of the plasma IL-17A levels in the IND and CARD groups by logistic regression, and the proportion of all cases that score greater than any given cutoff (sensitivity) against the proportion of the IND patients that would also exceed the same cutoff (specificity) was plotted. The slope of the tangent line at a cutpoint indicates the likelihood ratio for that value of the test and the diagonal line represents random prediction.

