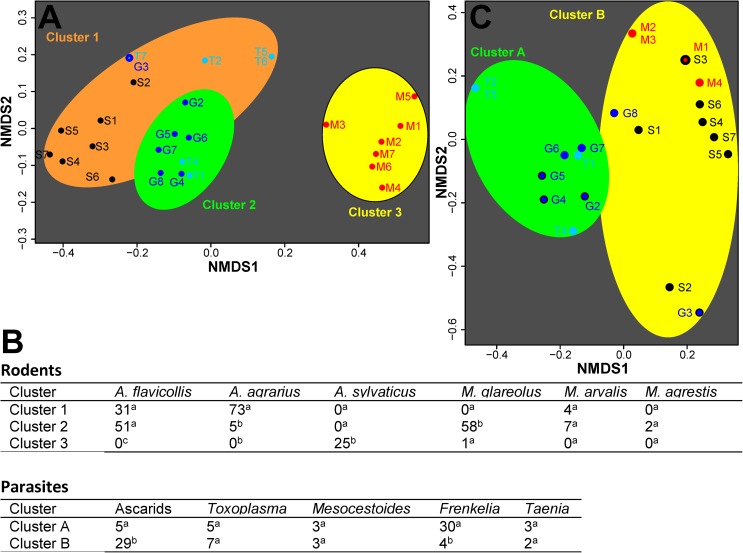
Fig 3. Identification of patterns using non-metric multidimensional scaling (NMDS) and k-means cluster analysis.
NMDS plots show similarity for trapped rodent species (A) or parasite-positive rodents (C) for the different trapping sites (G, Gatow, M, Moabit, S, Steglitz, T, Tegel) and trapping blocks (1–8). Rodents were considered to be positive for ascarids if the T. canis ELISA was positive or any ascarid species was detected by PCR. For every trapping week, the number of rodents of a particular species or the number positive for a particular parasite was used to calculate a Bray-Curtis dissimilarity matrix followed by NMDS. The matrix was used to identify the minimum number of k-means clusters which were indicated on the NMDS plots using ellipses of different colors. (B) Clusters were analyzed for differences in the proportions of particular rodent or parasite species (species relative to total number in that cluster) using mid-P exact tests. Numbers with different indices in the same column indicate significant differences (p<0.01) while identical indices indicate non-significant differences (p>0.05).

