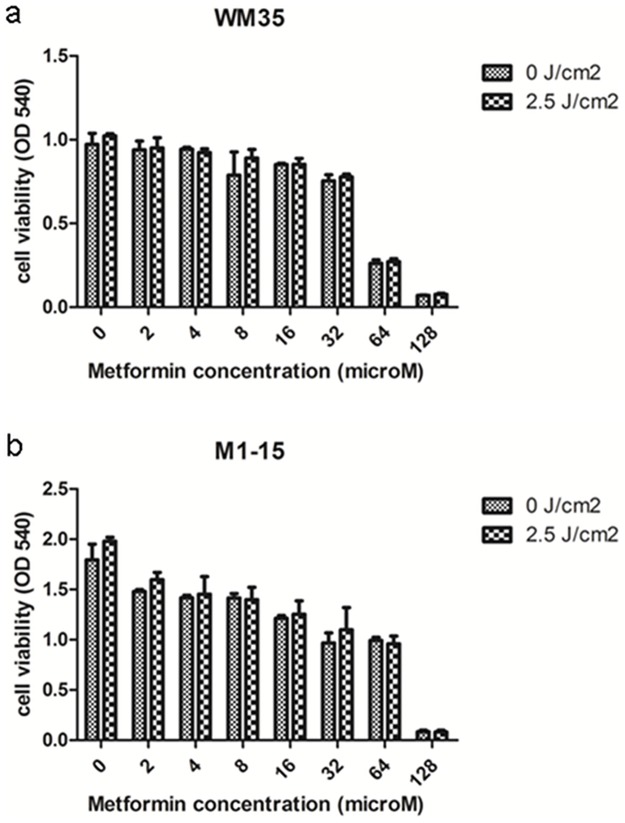
Fig 2. Viability testing after Metformin exposure.
Melanoma cell cultures exposed to different concentrations of Metformin or Metformin and irradiation (a)WM35 and (b)M1-15. OD 540 graphs were generated using GraphPad Software and show mean values ± standard deviation, n = 3 for each sample. Cell viability of both cell lines was decreased by increasing concentrations of Metformin, in a dose dependent manner; irradiation had no effect on the cell viability.

