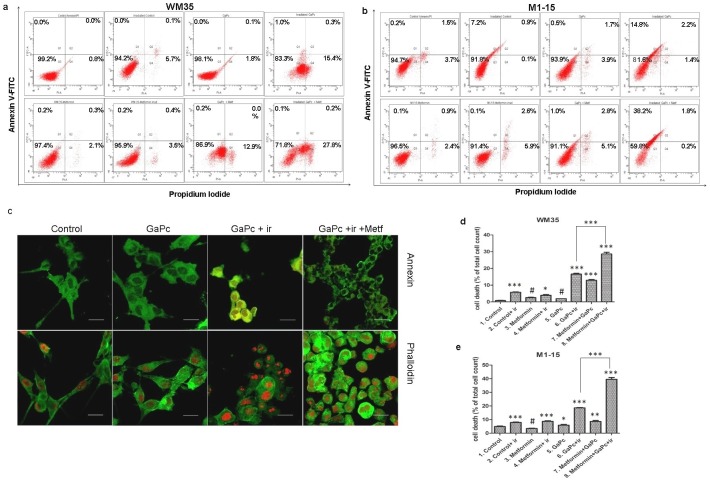
Fig 4. Cell death assessment.
Comparative FACS analysis following GaPc-PDT + Metformin treatment versus controls in WM35 (a) and M1-15 (b) cells; c- confocal microscopy images of treated WM35 cells stained with annexin V-FITC/ PI (upper panels) and phalloidin-FITC and DRAQ5 (lower panels), original magnification 63x; PDT exposed cells showed annexin V positive (green) and some exhibit PI positive red fluorescence, while Metformin addition increased the number of annexin V/PI positive cells, there are also present stress related morphological changes; phalloidin staining showed cytoskeleton alterations like increased condensations of actin filaments, retraction of dendrites, spherical shaped cells and loss of cell adhesion in PDT w/o Metformin treated cells. d, e quantitative FACS results for WM35 (d) and M1-15 (e) are expressed as % of total dead cells—annexin V and PI positive cells, from the total cell number; ir = irradiated cells; # = not significant, * = p<5.0E-02, ** = p<1.0E-02, *** = p<1.0E-03. Each bar represents mean ± standard deviation (n = 3).

