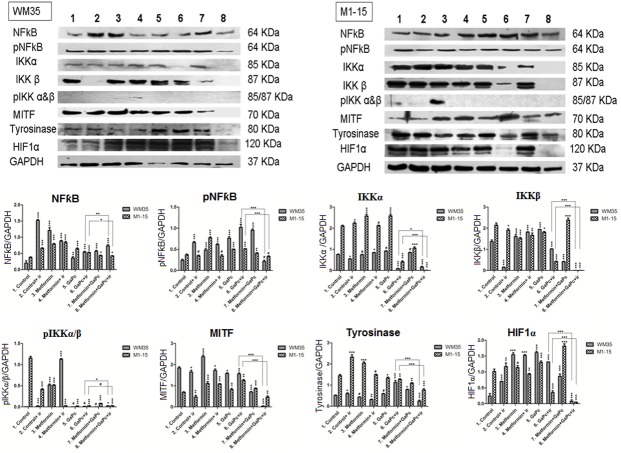
Fig 7. Protein expression measured by Western Blot.
Protein expressions of NF-κB, pNF-kB, IκKα, IκKβ, pIκK α/β, HIF1α, tyrosinase and MITF in melanoma cells treated with GaPc-PDT + Metformin, left panel (WM35), right panel (M1-15) were measured by WB. Image analysis of WB bands was done by densitometry, results were normalised to GAPDH.—WB images (upper panels) 1 = control, 2 = irradiated control, 3 = Metformin, 4 = irradiated Metformin, 5 = GaPc, 6 = GaPc-PDT, 7 = GaPc and Metformin, 8 = GaPc-PDT and Metformin; graphical representation of quantitative WB results for WM35 and M1-15 (lower panels); ir = irradiated cells; # = not significant, * = p<5.0E-02, ** = p<1.0E-02, *** = p<1.0E-03. Each bar represents mean ± standard deviation (n = 3).

