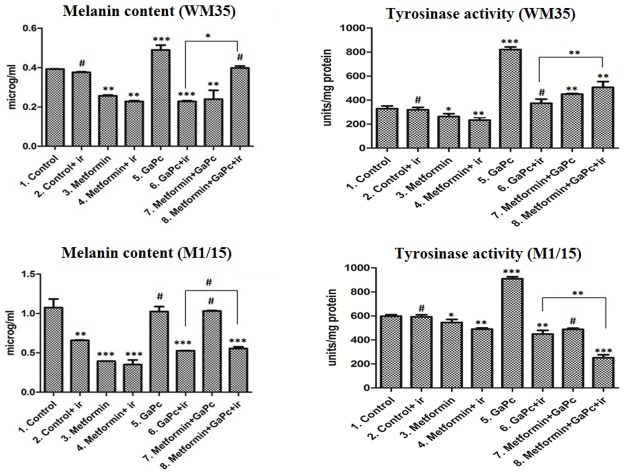
Fig 8. Melanogenesis.
Total melanin content (μg/ml) and tyrosinase enzymatic activity (Units/mg protein) measurements in WM35 (upper panels) and M1-15 (lower panels) were done by spectrophotometry. Each bar represents mean ± standard deviation (n = 3). ir = irradiated cells; # = not significant, * = p<5.0E-02, ** = p<1.0E-02, *** = p<1.0E-03.

