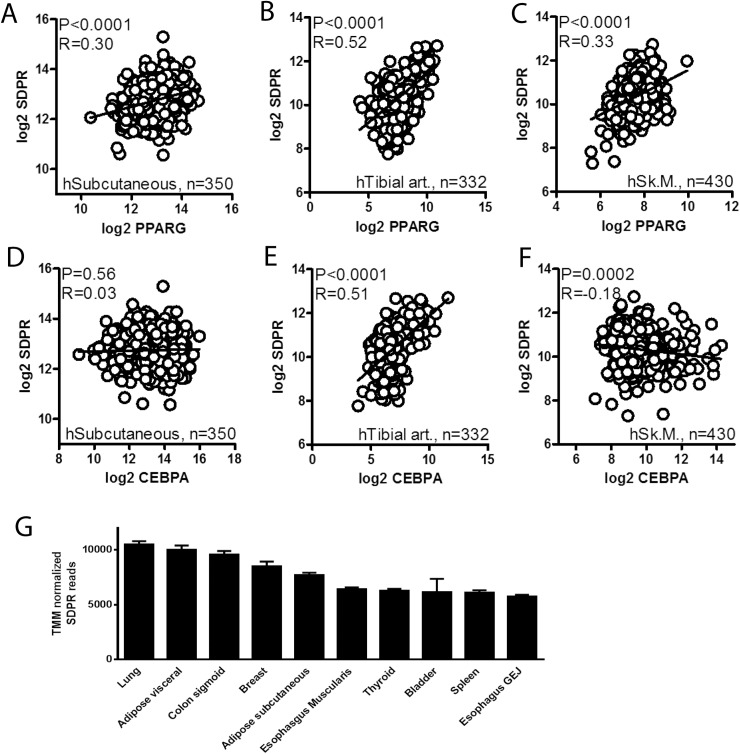
Fig 1. PPARγ expression correlates with cavin-2/SDPR expression in human tissues.
Panels A through F show correlations between PPARG and SDPR and between CEBPA and SDPR mRNA levels in the indicated human tissues. RNA-Seq data is from the Genotype-Tissue Expression (GTEX) portal [32] and normalization was according to the trimmed mean of M-values method. Correlations were tested using the Spearman method in GraphPad Prism 5. Nominal P-values (P) and Spearman's rank correlation coefficients (R) are given in the panels. Panel G shows TMM normalized RNA-Seq reads (means ± SEM) for SDPR in the top ten expressing tissues in the database.

