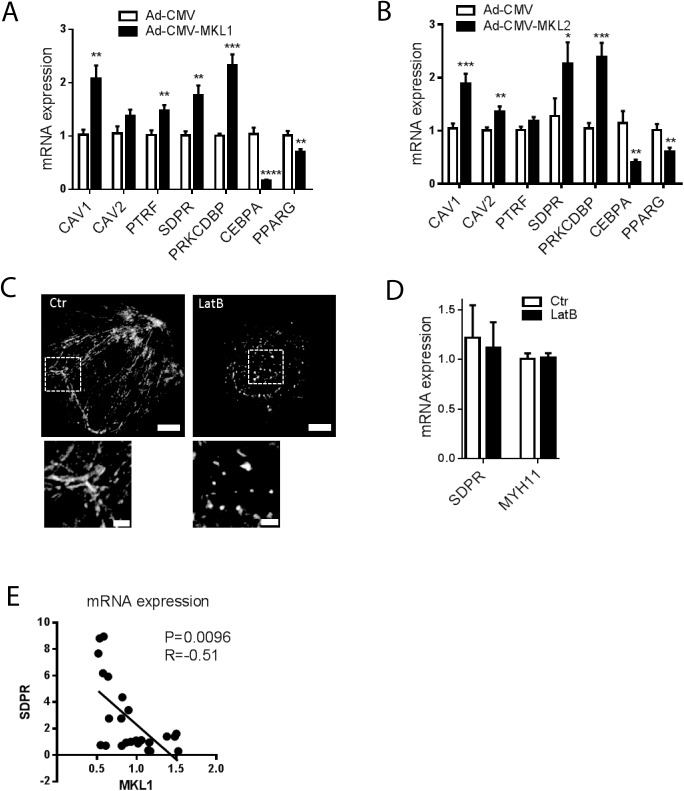
Fig 4. MKL1 and MKL2 drive expression of caveolins and cavins but SDPR expression is unresponsive to actin depolymerization in primary adipocytes.
Panels A and B show expression of CAV1, CAV2, PTRF, SDPR and PRKCDBP in primary adipocytes following incubation with adenovirus encoding MKL1 (Ad-CMV-MKL1, A), MKL2 (Ad-CMV-MKL2, B) or control adenovirus (Ad-CMV-null). n = 6–10 independent experiments. Panel C shows actin staining in control adipocytes (Ctr, DMSO) and in adipocytes treated with latrunculin B (LatB) for 16h. Bars represent 10 μm in upper panels. Magnifications of actin cables, and puncta, respectively, are shown in the lower panels where bars represent 2 μm. n = 3 independent experiments where 10–15 images were captured per experiment. Panel D shows the SDPR mRNA level in primary adipocytes following incubation in the absence and presence of LatB (10 μM) for 16 h. Control cells (ctr) were incubated with DMSO. n = 3 independent experiments. Panel E shows that the mRNA levels for MKL1 and SDPR are negatively correlated during adipocyte differentiation. Data in panels A through D is presented as means±SEM, *p≤0.05, **p≤0.01, ***p≤0.001 and ****p≤0.0001.

