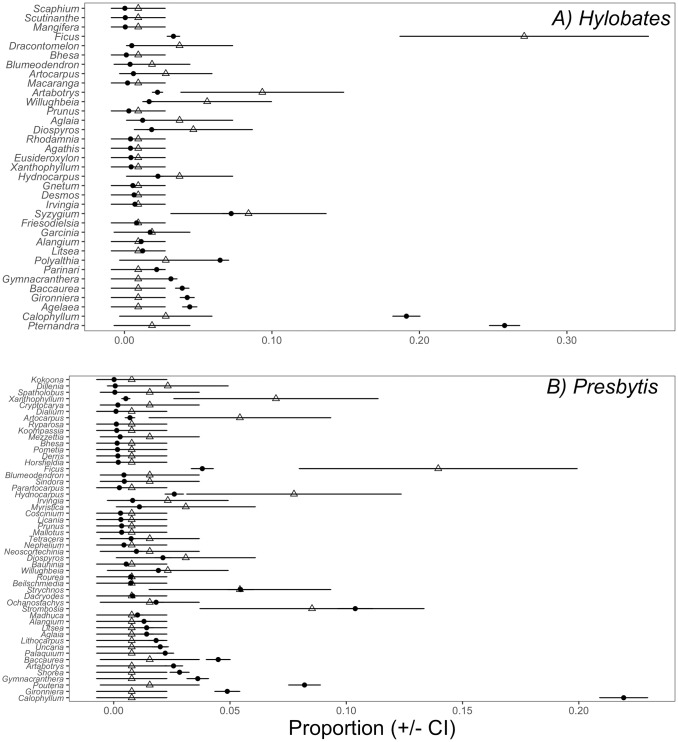
Fig 3. Feeding selectivity in gibbons (3a) and leaf monkeys (3b).
Closed circles indicate availability (proportion of fruiting observations of genus i, out of total fruiting observations), open triangles indicate use (proportion of the diet), and error bars are 95% confidence intervals. Non-overlapping confidence intervals indicate positive selectivity (when triangles (use) are to the right of circles (availability)) or avoidance (when triangles (use) are to the left of the circles (availability)). Genera are listed from top to bottom in decreasing order of absolute selectivity values.

