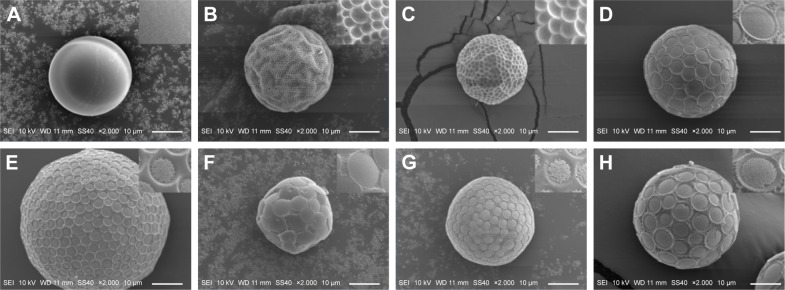
Figure 1.
Scanning electron micrographs of microspheres fabricated under different conditions.
Notes: (A) Group 1, (B) Group 2, (C) Group 3, (D) Group 4, (E) Group 5, (F) Group 6, (G) Group 7, and (H) Group 8. Groups 1–8 represent different fabrication conditions of microspheres. Each group has different a mass ratio of rifapentine and linezolid, stirring rate. and drug-to-polymer ratio of miscrospheres.

