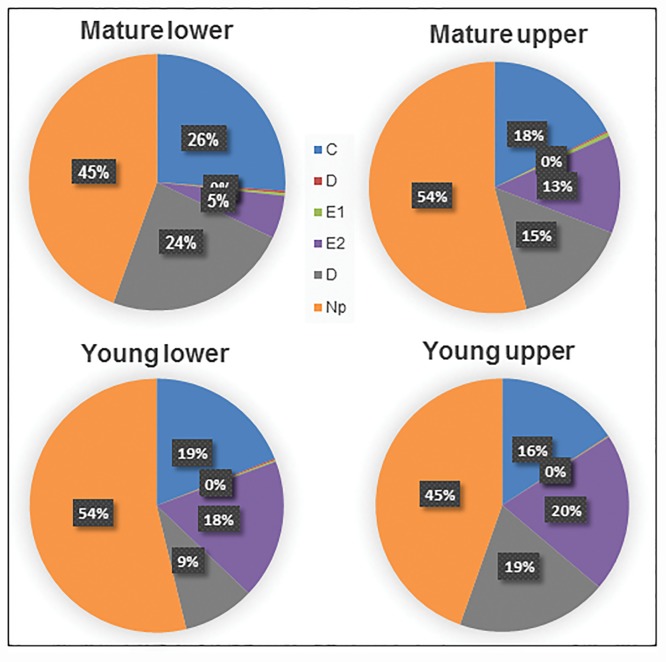
Fig 3. Pie chart showing percentage of the total duration for each feeding activity (waveform) by D. citri adults on lower and upper surfaces of mature and young leaves.
Phloem penetration (D) and salivation (E1) contributed to <1% of total feeding activity. The longest duration of phloem ingestion was observed on young upper leaf surface and shortest phloem ingestion duration on mature lower leaf surface.

