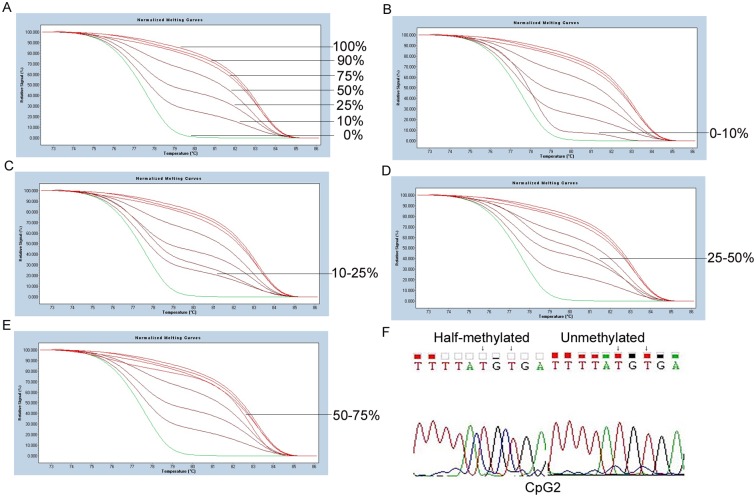
Fig 3. Methylation status of CpG2 in leukemia cells. A: Standard melting curve of CpG2. B, C, D and E: Represent samples of different CpG2 of GGH methylation levels: 0–10%, 10–25%, 25–50%, 50–75%. F: Sequencing results of methylated samples detected by HRM.
In picture A, the seven melting profiles represent PCR products derived from the mixes of 100, 90, 75, 50, 25, 10, and 0% of fully methylated template in an unmethylated background, respectively.

