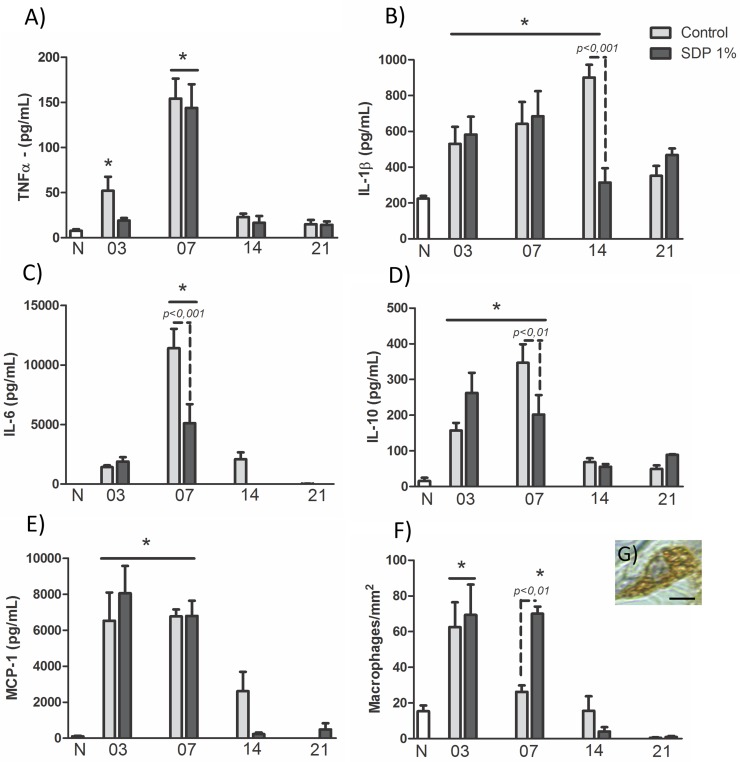
Fig 2. Cytokines and macrophages in wound healing in a second degree burn.
(a) TNF-α: high dosages in C3 and in both groups after 7 days. (b) IL-1β: high levels in both groups on days 3 and 7 and also in C14. (c) IL-6: overexpression on day 7, especially in the control group. (d) IL-10: Increased levels on days 3 and 7. (e) MCP-1: overexpression on days 3 and 7. (f) Macrophages: numerous macrophages on day 3 and SDP7. (g): Macrophage. Counter-staining: Hematoxilin. Bar 2μm. Values are presented as mean ± S.E.M. (n = 5/group). * p<0.05 vs Normal Skin (N).

