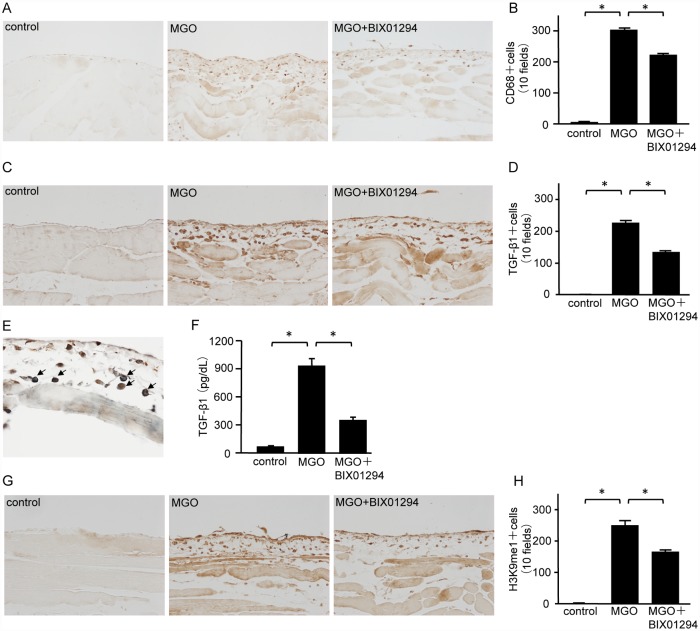
Fig 5. BIX01294 inhibits monocyte/macrophage infiltration, TGF-β1, and H3K9me1 in mice with peritoneal fibrosis.
(A) Immunohistochemical staining shows typical CD68 expression in peritoneal tissue of control mice, MGO-injected mice, and MGO-injected mice treated with BIX01294 (original magnification, ×200). (B) Graph indicates the number of CD68-positive cells in the three groups of mice. (C) Immunohistochemical staining shows typical TGF-β1 expression in peritoneal tissue of control mice, MGO-injected mice, and MGO-injected mice treated with BIX01294 (original magnification, ×200). (D) Graph indicates the number of TGF-β1-positive cells in the three groups of mice. (E) Two-color immunohistochemical staining shows that most CD68 cells (brown) are immunoreactive for TGF-β1 (blue-gray) (arrows). (F) TGF-β1 protein levels in mouse PD effluent were quantified by ELISA. (G) Immunohistochemical staining shows typical H3K9me1 levels in peritoneal tissue of control mice, MGO-injected mice, and MGO-injected mice treated with BIX01294 (original magnification, ×200). (H) Graph indicates the number of H3K9me1-positive cells in the three groups of mice. Data are expressed as the mean ± SE. Statistical analysis were performed by analysis of variance followed by Tukey’s post-hoc test. *P < 0.05, n = 5 mice per group.

