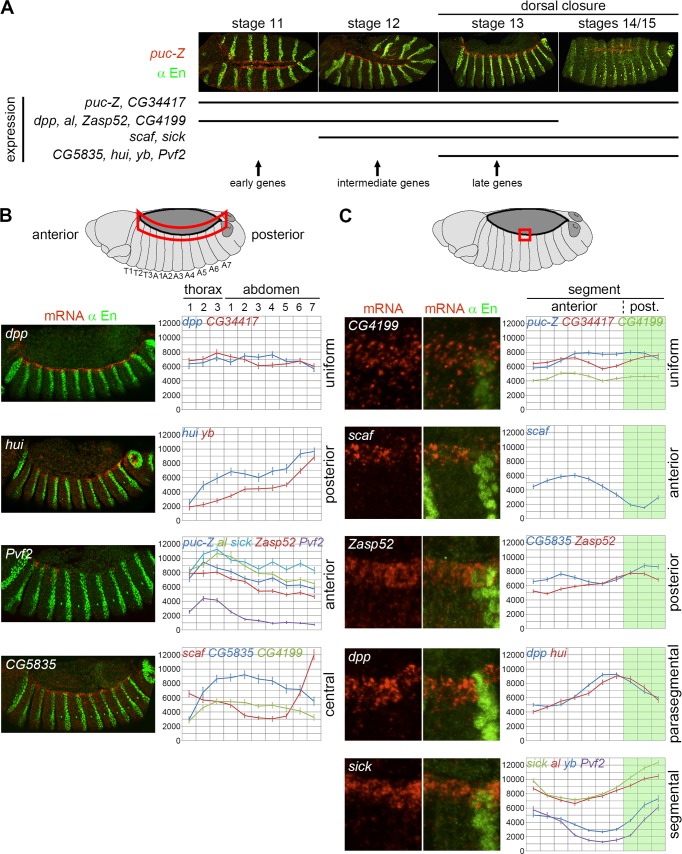
Fig 3. Spatio-temporal regulation of JNK target gene expression at the LE.
A) Temporal expression (black lines) of the twelve LE genes from stage 11 (full extension of the germ band) to stages 14/15 (end of DC), including stage 12 (germ band retraction) and stage 13 (onset of DC). Expression was monitored in WT embryos using FISH-IF, as shown with puc-Z/+ embryos (upper panels; lacZ mRNA in red and anti-En staining in green). B) Quantitative analysis of the expression of the twelve LE genes along the AP axis of the fly embryo (right panels), with one representative gene (FISH-IF, left panels) for each of the four categories identified: uniform (dpp, CG34417), posterior (hui, yb), anterior (puc-Z, al, sick, Zasp52, Pvf2) and central (scaf, CG5835, CG4199). LE mRNA quantification from FISH-IF experiments is based on the average fluorescent intensity in each segment from T1 to A7, as indicated by the red area on the depicted embryo (top panel). Expression is indicated as fluorescent intensity (a.u. +/- s.e.m.). n = 20 embryos, except for hui (n = 15) and yb (n = 16). C) Segmental expression of the LE genes. Each FISH-IF panel (left panels) displays one representative example of the five groups: uniform (puc-Z, CG34417, CG4199), anterior (scaf), posterior (CG5835, Zasp52), parasegmental (dpp, hui) and segmental (sick, al, yb, Pvf2). On average, the segments are formed by ten cells of which seven are anterior (white) and three posterior (green). mRNA signal quantification (right panels) for a given gene is based on the average fluorescent intensity (a.u. +/- s.e.m.) in each of the ten cells of all the segments taken together.

