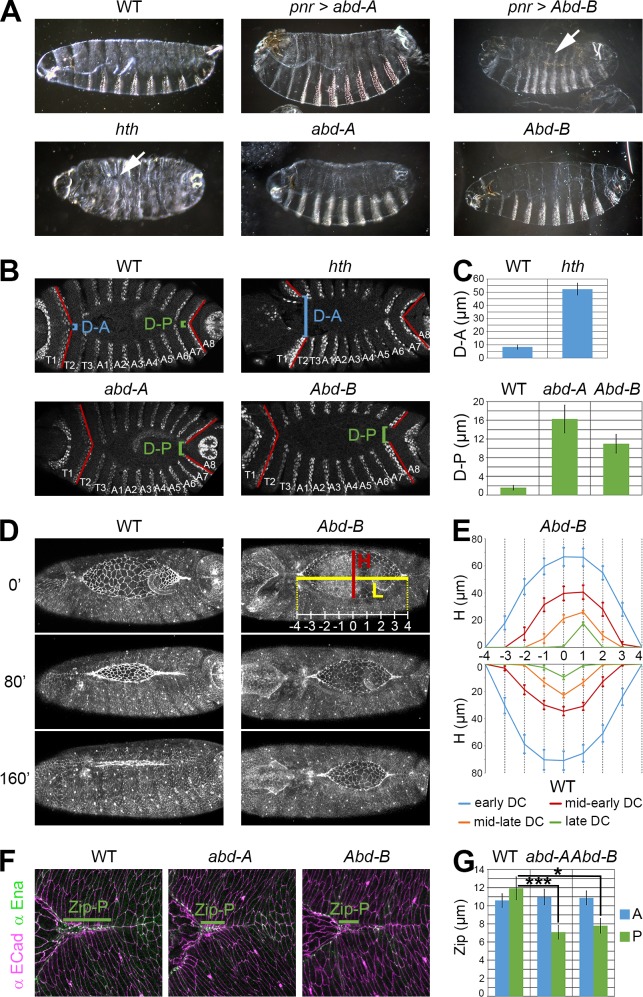
Fig 7. DC phenotypes of HOX mutant embryos due to zipping defects.
A) Cuticles of a WT embryo (top left), abd-A- and Abd-B-overexpressing embryos with pnr-GAL4 (top middle and top right, respectively), hth, abd-A and Abd-B mutants (bottom panels, as indicated). The overexpression of Abd-B induces holes in the cuticles (arrow; 48% of the dead embryos, n = 200), revealing strong closure defects. The hth mutant also produces a DC phenotype, with holes located in the anterior part (arrow; 76% of the dead embryos, n = 117). In contrast, the cuticles of abd-A-overexpressing embryos, abd-A and Abd-B mutants resemble that of WT embryos. B) Anti-En immunostaining of the hth (top right), abd-A (bottom left) and Abd-B (bottom right) mutants compared to WT embryos (top left). For hth, the distance in the anterior (D-A) between the two opposing En-expressing compartments of T1 is determined when the A8 segment just closed. For abd-A and Abd-B, the distance in the posterior (D-P) between the two opposing En-expressing compartments of A7 is determined when the T1 segment just closed. The red lines delimitate the posterior boundaries of the T1 and A7 segments. C) Quantification of D-A (μm +/- s.e.m., top panel) for the hth mutant and D-P (μm +/- s.e.m., bottom panel) for abd-A and Abd-B mutants. In WT embryos, T1 is almost closed (D-A = 8.3 μm +/- 1.6, n = 20) when A8 just closed, but the hth mutant shows a strong anterior opening ((D-A = 52.3 μm +/- 4.5, n = 17). In the posterior part of WT embryos, A7 is usually closed (D-P = 1.6 μm +/- 0.5, n = 18) when T1 just closed. In contrast, the abd-A and Abd-B mutants exhibit a posterior delay of closure (D-P = 16.3 μm +/- 3.0, n = 19, and D-P = 11.0 μm +/- 2.0, n = 16, respectively). D) Still images of arm-GFP and arm-GFP;Abd-B live embryos from S1 Movie. Compared to the dynamics of the arm-GFP (WT) embryo (left images), the closure of the Abd-B mutant (right images) is slowed down: at 160 minutes, the abd-B mutant embryo is still undergoing closure while the WT embryo is closed. Height (H) between the two opposing LE and length (L) of the projected LE at the midline between the two zipping zones that are used in C) are depicted in the top right panel. H is quantified at fixed positions along L, as indicated. E) Height (H, μm +/- s.e.m.), as defined above, during early DC (seam < 25%; blue), mid-early DC (25% < seam > 50%; red), mid- late DC (50% < seam > 75%; orange), and late DC (seam > 75%; green) at fixed positions of L. Whereas the control embryos (n = 9) close right in the middle, Abd-B mutants (n = 6) exhibit a posterior shift of their closure point at the end of DC (shift corresponding to approximately 1 segment). F) Anti-Ena (green) and anti-ECad (magenta) immunostainings showing the posterior zipping zones (Zip-P) in the A6 segment of a WT embryo (left) and of abd-A (middle) and Abd-B (right) mutants. The zipping zone is defined by the area where the two opposing LE are in close contact till the formation of a stable adherens junction (stained with ECad). G) Quantification of the anterior (A of the T2 or T3 segment, blue) and posterior (P of the A6 or A7 segment, green) zipping zones of the WT embryo and the two HOX mutants. Whereas no variation is observed in the anterior part (no statistical significance), the Zip-P of abd-A (7.1 μm +/- 0.7) and Abd-B (7.8 μm +/- 0.8) are reduced compared to the WT embryo (11.9 μm +/- 1.2). Multiple comparisons of Zip-A or Zip-P between WT, abd-A and Abd-B were performed using the Dunnett test with R (*: p < 0.05; **: p < 0.01; ***: p < 0.001). For Zip-A and Zip-P of WT embryos, n = 15; for abd-A, n(Zip-A) = 15 and n(Zip-P) = 16; for Abd-B, n(Zip-A) = 10 and n(Zip-P) = 13.

