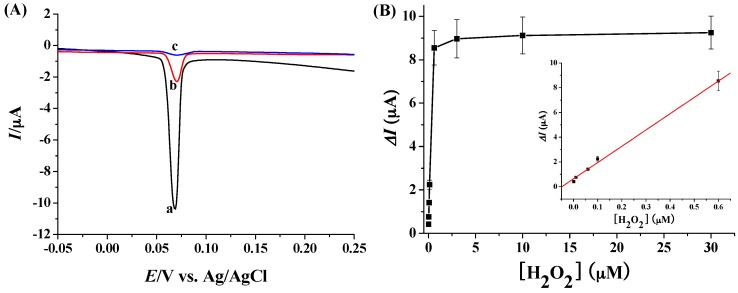
Figure 5.
(A) LSV responses of the boronate-covered electrodes after incubation with the mixture of Ag NPs and BDBA (curve a) or Ag NPs only (curve b). Curve c corresponds to that of H2O2-treated boronate-covered electrode after incubation with the mixture of Ag NPs and BDBA. The final concentrations of Ag NPs, BDBA and H2O2 used were 2 nM, 8 µM and 3 µM, respectively; (B) Dependence of ΔI on H2O2 concentration (0.001, 0.01, 0.06, 0.1, 0.6, 3, 10 and 30 µM). The inset shows the linear part of the curve.

